This blog post was inspired by the talk given by Prof. Yusu Wang during SGI. We use Topological Data Analysis to showcase its feature characterization principles and how it can be used for point cloud surface reconstruction. The code used to generate the different results below are stored on SGI’s GitHub, so give it a try. Let’s go!
Brief Introduction into Persistent Homology
Persistent homology is formed of two words: persistent and homology. Homology comes from homology groups, an intersection between group theory and topology. On a high-level, two objects are homotopic if they can be continuously deformed into one another. As such, they belong to the same group or class because they share the same properties. These homotopy properties can be commonly referred to in examples as the number of holes that an object possesses.
Homology is then used to describe more complex objects such as Simplicial Complexes and Functions.
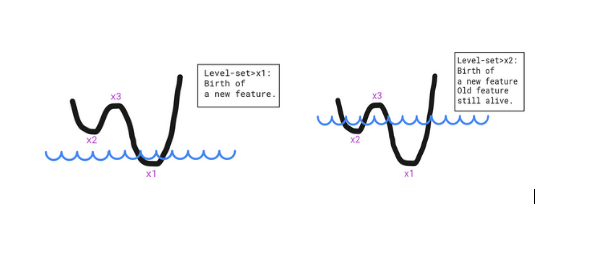
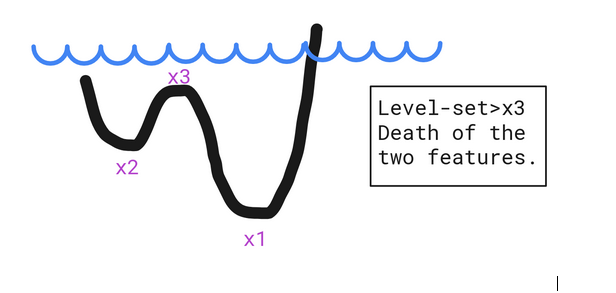
If we take functions, we can map every set level to a property that describes this function. This can best be seen as features induced by local extrema. Local minima tell us that a new feature was born (similar to the hole concept) and the local maxima tell us that some features have been merged and as a result no longer exist. The function below showcases two minima, which means two features are alive at some point simultaneously and disjointly (two separate holes filled water), but will disappear and be merged once the level-set reaches the local maximum.
For a set of points, the characterization happens by first constructing a Simplicial Complex (Vietoris-Rips Complex, Čech Complex,…). This follows a logic which connects the points whose circles with radius r centered around them intersect. This is how k-simplices (such as points, edges,triangles, etc. where k is the number of mutually intersecting circles) are built. What happens afterwards is that, in order to find the characteristics of a set of points, the radius r is increased and as we go, the features are detected from the resulting Simplicial Complex.
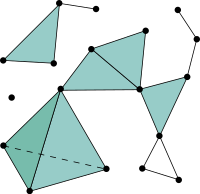
Source: https://en.wikipedia.org/wiki/Simplicial_complex
Now that we have our features, we need to measure their importance and this is what persistence is meant to do. Persistence, is then the act of quantifying the difference between the death and birth of these features, i.e how long a specific feature existed. which helps in assessing the importance of a feature.
For this reason, Persistent Homology can serve as a de-noising tool or can simply act as an object descriptor.
GUDHI: Library for Topological Data Analysis (TDA)
Now, let’s see all of the concepts we have explained in practice. For that, we will use the GUDHI library for Topological Data Analysis.
We present the following examples to showcase the persistence diagrams obtained for different set of points.
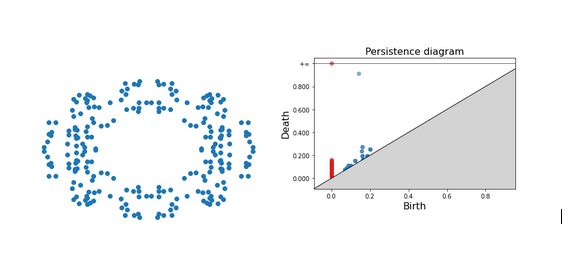
Persistence diagrams have these properties: 1) The red points are the 0-simplices, which are dots, points or disks. 2) The blue points are the 1-simplices characterized by a hole. 3) The points that are far off the diagonal live longer, which means that they are more prominent/important.
For the first example, we can see for instance that one blue dot is very far from the diagonal, which means that this is one of the most important features of our set. The other blue dots which stem from the gap between our points but disappear quickly.
For the second example, we present two persistence diagrams based on two maximum radius thresholds. For a small threshold, we only have one blue dot; the smaller ring is detected because a small threshold matches its small radius. As this threshold gets bigger, we are then able to detect the second bigger ring. Increasing the threshold even further merges these two circles into one component as the different vertices get connected in an indiscernible way.
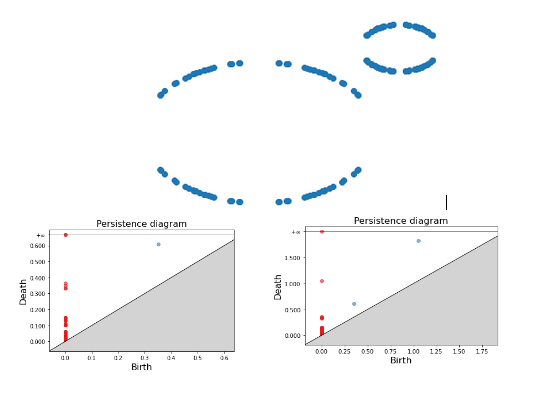
2) (Right) Persistence Diagram of a set of points forming two rings with a big maximum threshold.
Surface Reconstruction with TDA
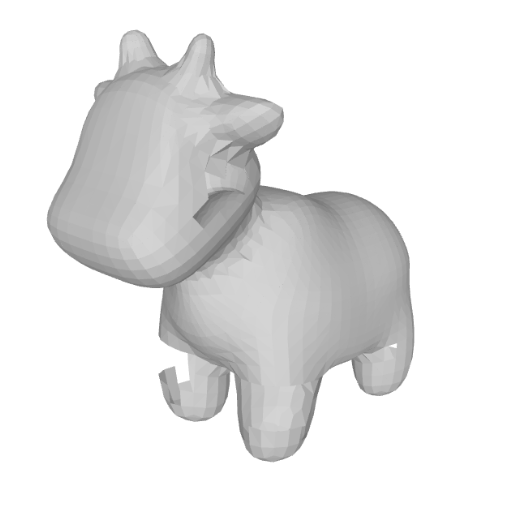
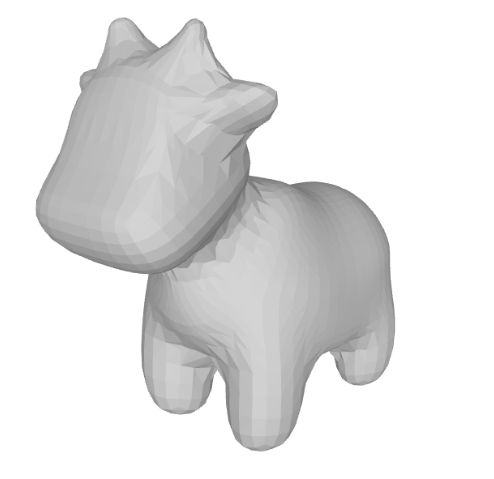
Now that we have used the different elements from the Topological Data Analysis, we will adopt the Simplicial Complex concept and use it to create the surface of a known mesh: spot.
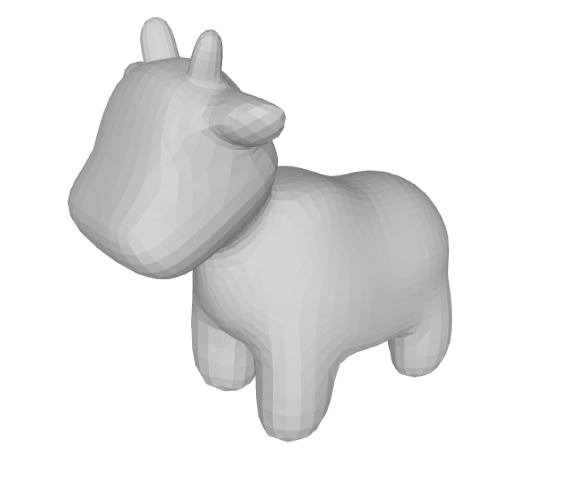
We only consider the point cloud from the mesh and try to estimate the surface by creating the connections between three vertices at once. Once these connections are made, we save a new mesh with these faces connections. Depending on the threshold set to connect the vertices we obtain different levels of precision:
Conclusion
We have shown in this blog post how Topological Data Analysis and in particular Persistent Homology can be used to find structure in a set of points. This can lead to characterizing the set’s properties in addition to allowing the execution of known tasks in Geometry Processing such as Surface Reconstruction.
References
[1] Persistent Homology—a Survey, Herbert Edelsbrunner and John Harer.
[2] https://en.wikipedia.org/wiki/Homology_(mathematics)
[3] GUDHI, https://gudhi.inria.fr/