
Project Mentor: Nicholas Sharp
SGI Volunteer: Qi Zhang
This blog post is a follow up to “How to match the “wiggliness” of two shapes”, where we discussed the metrics we use to measure the similarity between two surfaces. In that post, we briefly talked about approximating a surface by using a regular grid to generate vertices for an approximation mesh. There we observed that as we increased the number of vertices, the surface approximation error decreases. This is somewhat intuitive – as you increase the “fineness” of the approximation mesh, the more closely you would expect it to approximate the actual surface. However, in practical applications we aim to keep the number of vertices as low as possible, in order to reduce both memory space and the amount of runtime computation.
So what can we do to improve the surface approximation without increasing the number of vertices? Are there better ways to select vertices – such that we can minimize the chamfer distance error? This is what we will be exploring in this post.
Regular grids
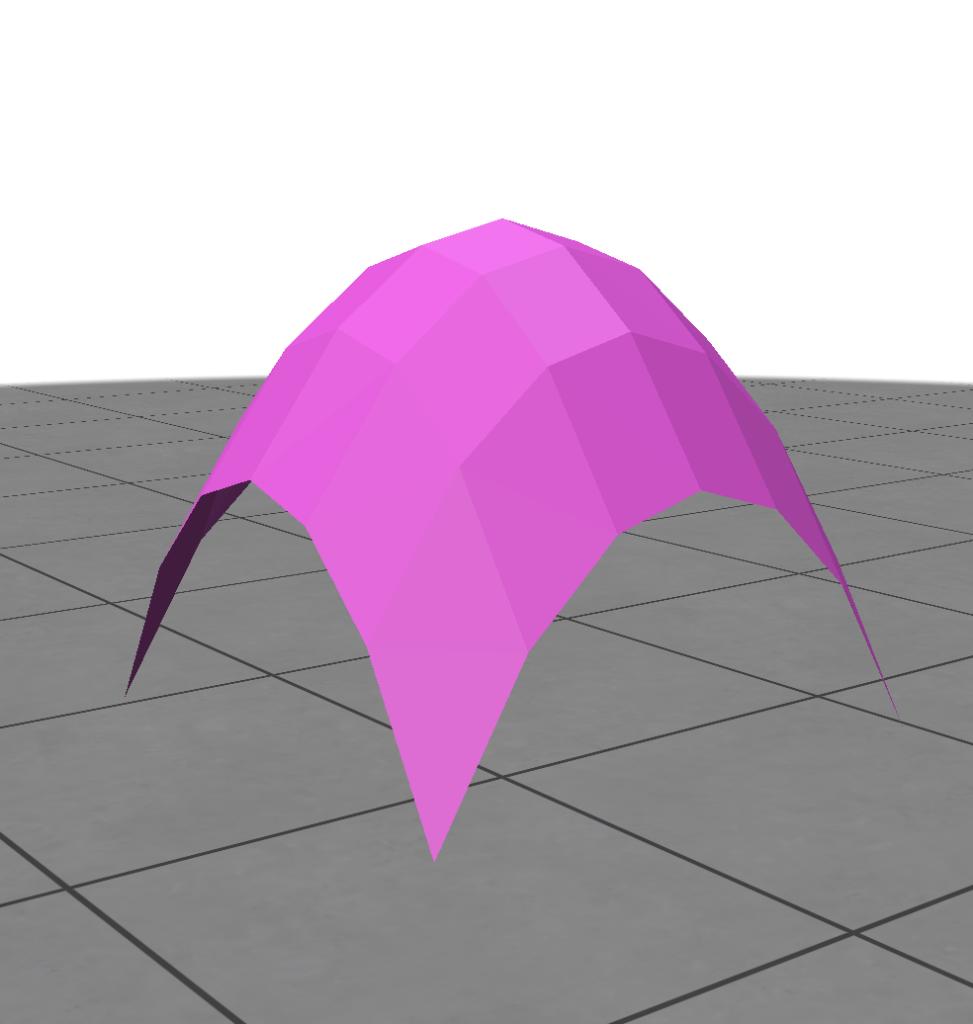
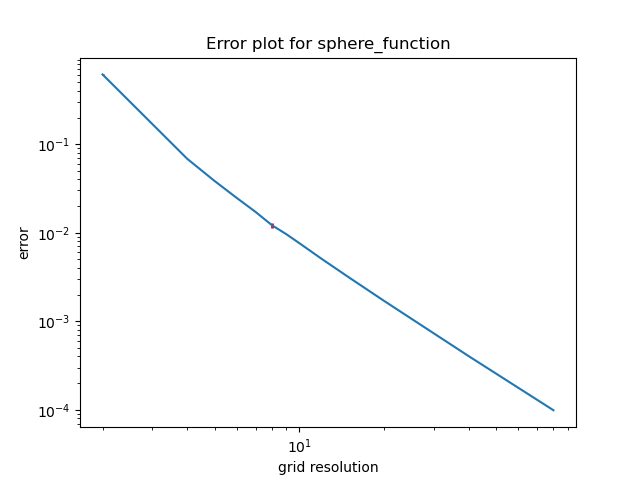
Before we try different ways of selecting vertex positions. Hence we repeat the same experiment with a few different surfaces, using a regular grid to generate mesh vertices. First we start with three basic cases with different gaussian curvatures:
- Sphere function (positive gaussian curvature)
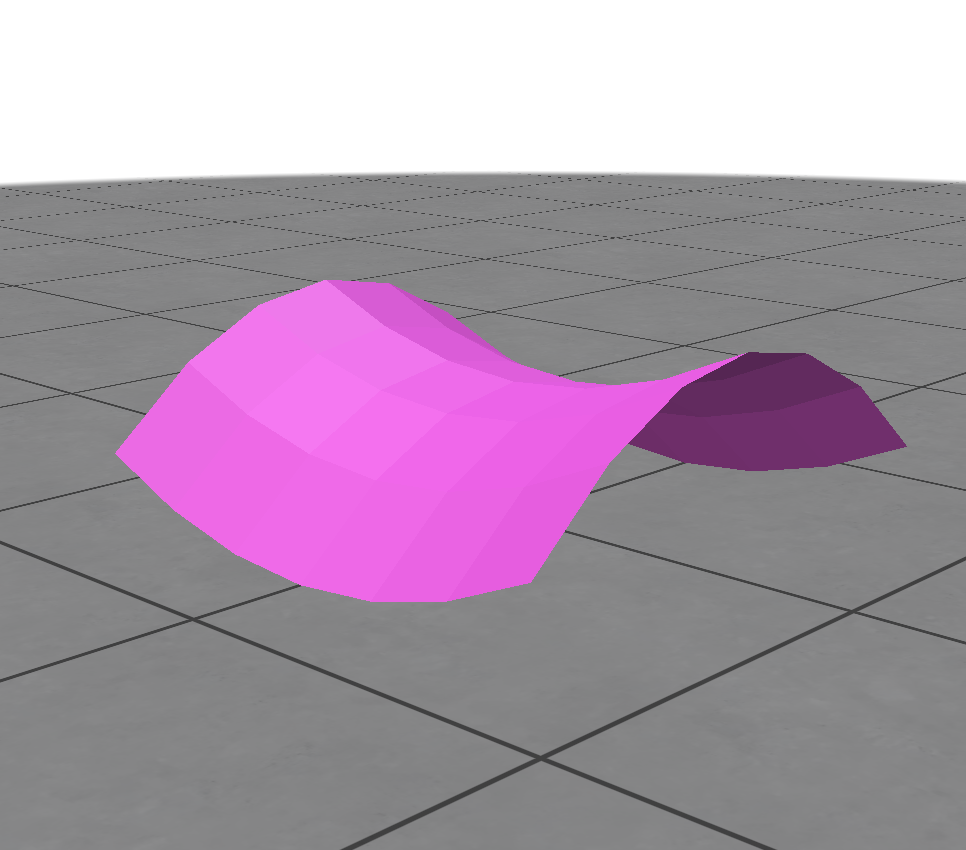
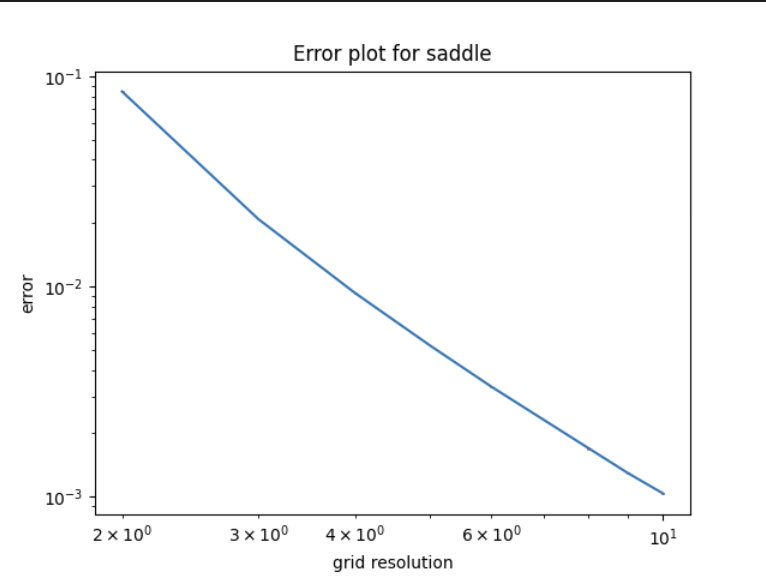
2. Saddle function (negative gaussian curvature)
3. Quadratic function (0 gaussian curvature)

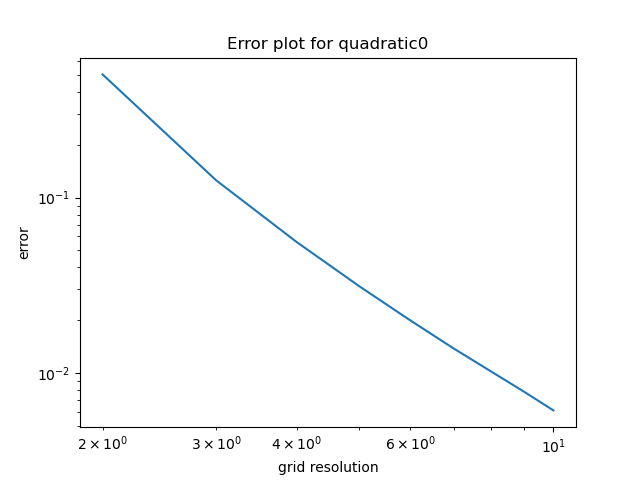
So far everything works well similarly to the previous blog post – the error decreases consistently as the grid resolution.
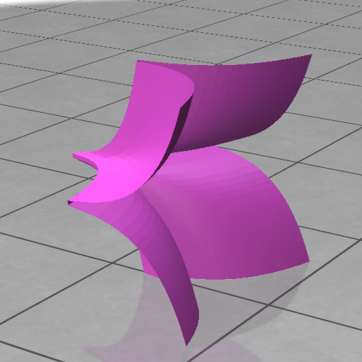
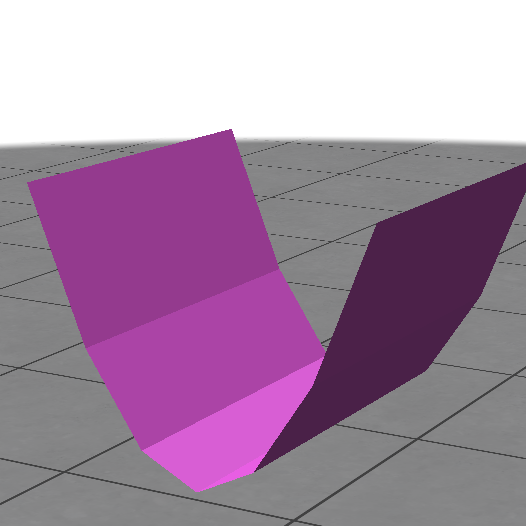
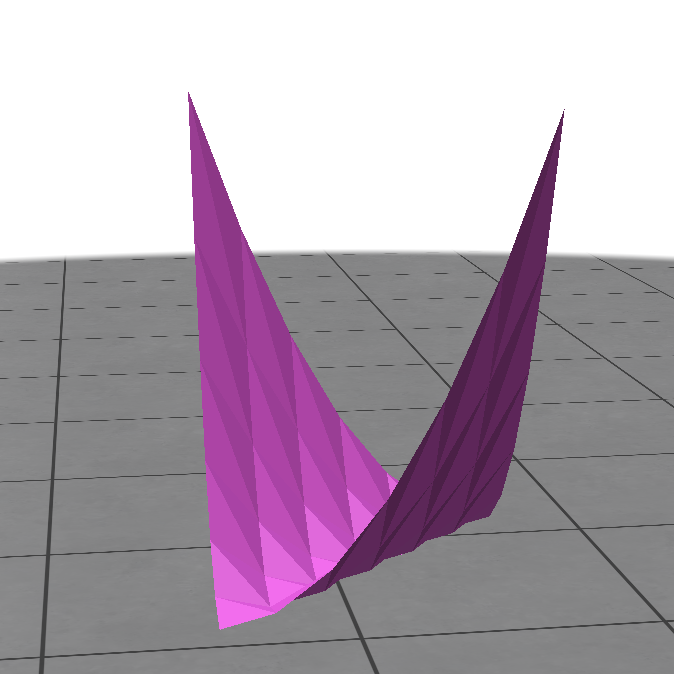
In order to really visualize the limitations of using the regular grid to sample points on the mesh, we decided to also include a more “extreme” function that looks harder to approximate – the Cross-in-tray function, which has a few asymptotes.
4. Cross-in-tray function
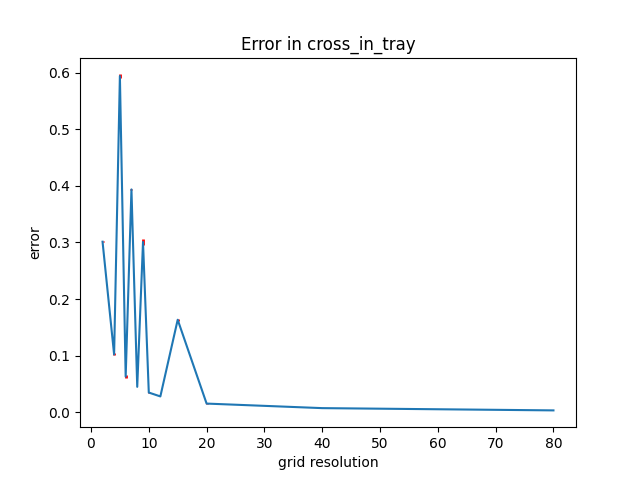
For this function, we noticed something unusual. When we increase the grid resolution from 6×6, to 7×7, to 8×8, we notice a sharp increase, then decrease in error, unlike the consistent decrease in error as we saw before.
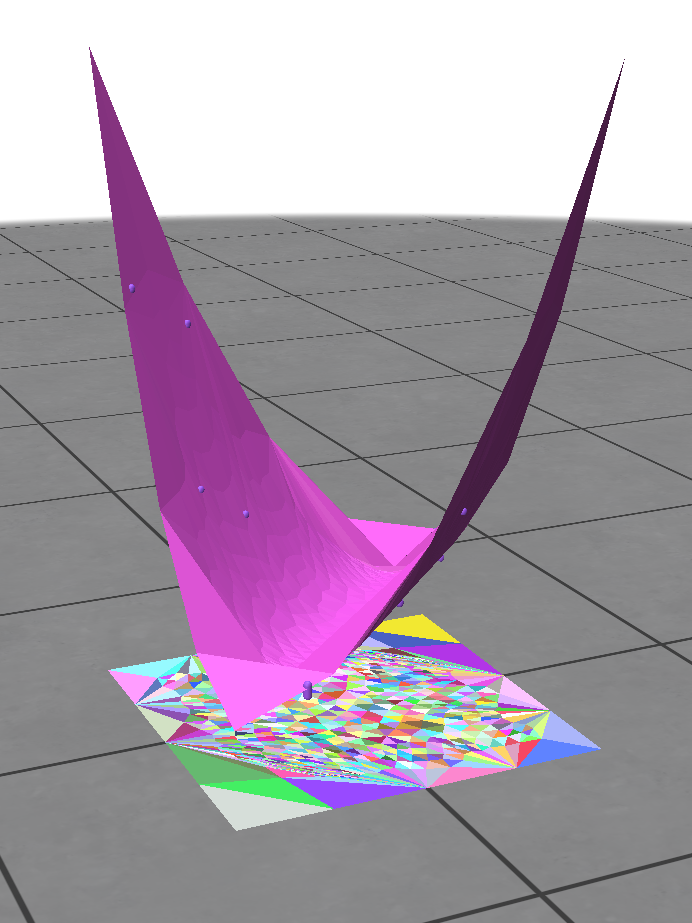
We decided to visualize what might be causing this in the figures 9-11 below, where the green transparent surface represents a close approximation of the actual surface, and the magenta surface shows the surface generated by sampling the regular grids with the different dimensions mentioned .

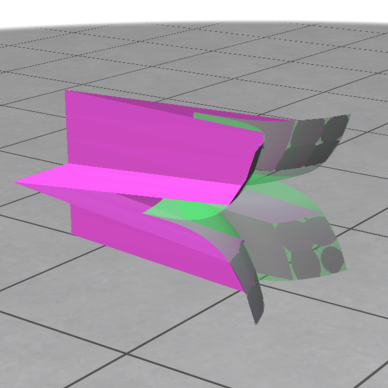

As seem above, the increase in the approximation error for the 7×7 regular grid is caused by the alignment of the selected vertices with the planes that the asymptotes lie on.
This is an interesting observation, as we can visibly see that the alignment of the vertices to certain features or properties of a surface affects the surface approximation error. There have been works [1][2] that have touched on heuristics about how when the mesh edges are orthogonal to the direction of principal curvature of the original function it often (but not always!) results in a lower approximation error. The next two type of experiments look into this further.
Rotated surface function
We decided to test the alignment of the edges to the direction of principal curvature on the quadratic function, as we could easily identify this direction for this function. We rotated the surface by different angles and generated approximations using the same regular grid, then plotted its error.
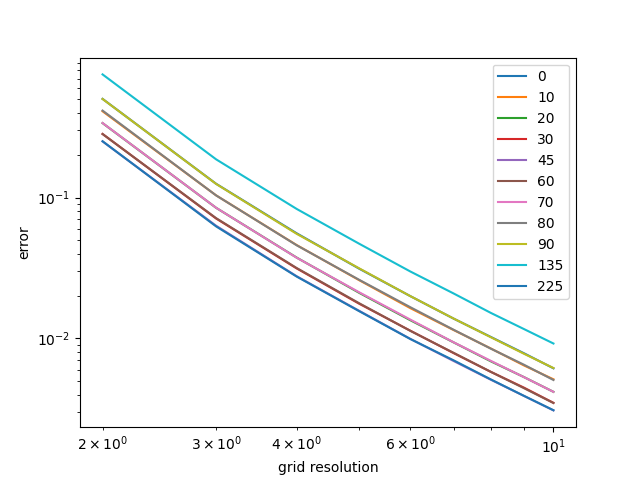
Interestingly, the error is the lowest when the quadratic function is rotated 45 degrees and 225 degrees and highest. This is notable because when the function is rotated 0 or 90 degrees, the short edges of the triangles are in fact orthogonal to the direction of principal curvature, so according to the heuristic these cases should have given the lowest error.
After closer observation we realized that the 45 degrees and 225 degrees cases are when the longest edge of the triangles are orthogonal with the curvature of the quadratic surface. Perhaps more work can be done to look into this in the future!
Re-meshed grid
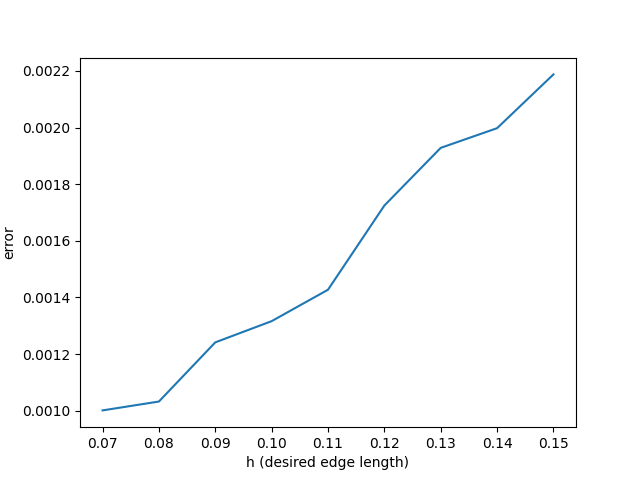
We also use the Botsch-Kebbelt re-meshing algorithm to re-mesh the regular grid, to generate more randomness in the alignment of the triangles to the principal curvature of the quadratic function. This algorithm takes in the surface as well as the desired average edge lengths of the the triangles in the mesh, and outputs to us a re-meshed surface. The images from left to right demonstrates what happens as we increase the average edge length that we pass in as a parameter.

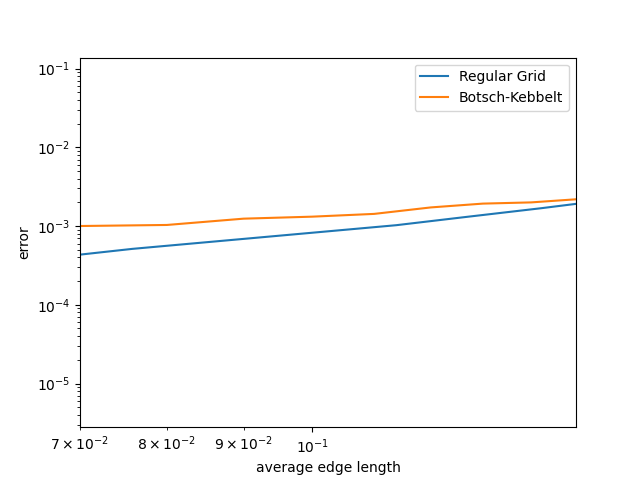
To make a more equal comparison, we converted the grid resolution to find the average edge length of the triangles in the regular grids and plotted its error together on a log-log graph. As we can see below, the regular grid does better than the Bosch-Kebbelt re-meshed grid. This is congruent with what we expected – that aligning the edges of the triangles would give us a lower error than just random orientations!
References:
[1] Bommes, David, et al. “Mixed-integer quadrangulation.” ACM Transactions on Graphics, vol. 28, no. 3, July 2009, pp. 1–10, doi:10.1145/1531326.1531383.
[2] Jakob, Wenzel, et al. “Instant Field-aligned Meshes.” ACM Transactions on Graphics, vol. 34, no. 6, Nov. 2015, pp. 1–15, doi:10.1145/2816795.2818078.