Author: Ehsan Shams (Alexandria University, Egypt)
“Since people have tried to prove obvious propositions,
they have discovered that many of them are false.”
Bertrand Russell
Archimedes proposed an elegant argument indicating that the area of a circle (disk) of radius \(r\) is \( \pi r^2 \). This argument has gained attention recently and is often presented as a “proof” of the formula. But is it truly a proof?
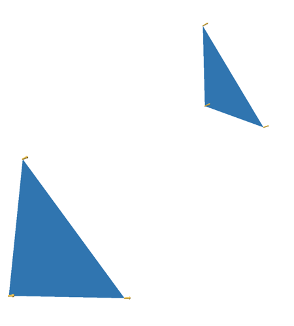
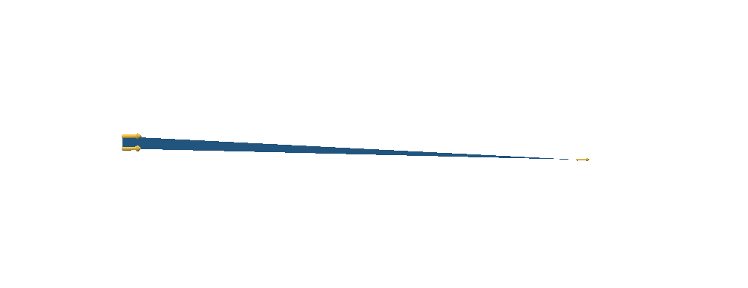
The argument is as follows: Divide the circle into \(2^n\) congruent wedges, and re-arrange them into a strip, for any \( n\) the total sum of the wedges (the area of the strip) is equal to the area of the circle. The top and bottom have arc length \( \pi r \). In the limit the strip becomes a rectangle, meaning as \( n \to \infty \), the wavy strip becomes a rectangle. This rectangle has area \( \pi r^2 \), so the area of the circle is also \( \pi r^2 \).
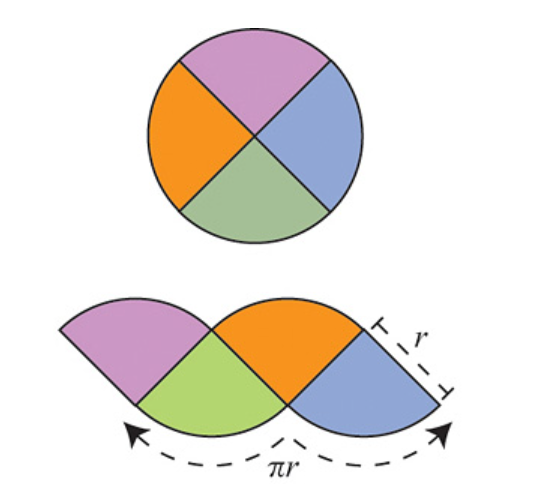
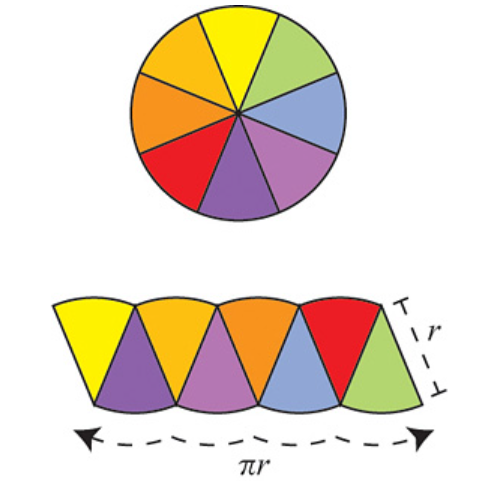
These images are taken from [1].
To consider this argument a proof, several things need to be shown:
- The circle can be evenly divided into such wedges.
- The number \( \pi \) is well-defined.
- The notion of “area” of this specific subset of \( \mathbb{R}^2 \) -the circle – is well-defined, and it has this “subdivision” property used in the argument. This is not trivial at all; a whole field of mathematics called “Measure Theory” was founded in the early twentieth century to provide a formal framework for defining and understanding the concept of areas/volumes, their conditions for existence, their properties, and their generalizations in abstract spaces.
- The limiting operations must be made precise.
- The notion of area and arc length is preserved under the limiting operations of 4.
Archimedes’ elegant argument can be rigorised but, it will take some of work and a very long sheet of paper to do so.
Just to provide some insight into the difficulty of making satisfactory precise sense of seemingly obvious and simple-to-grasp geometric notions and intuitive operations which are sometimes taken for granted, let us briefly inspect each element from the above.
Defining \( \pi \):
In school, we were taught that the definition of \( \pi \) is the ratio of the circumference of a circle to its diameter. For this definition to be valid, it must be shown that the ratio is always the same for all circles, which is
not immediately obvious; in fact, this does not hold in Non-Euclidean geometry.
A tighter definition goes like this: the number \( \pi \) is the circumference of a circle of diameter 1. Yet, this still leaves some ambiguity because terms like “circumference,” “diameter,” and “circle” need clear definitions, so here is a more precise version: the number \( \pi \) is half the circumference of the circle \( \{ (x,y) | x^2 + y^2 =1 \} \subseteq \mathbb{R}^2 \). This definition is clearer, but it still assumes we understand what “circumference” means.
From calculus, we know that the circumference of a circle can be defined as a special case of arc length. Arc length itself is defined as the supremum of a set of sums, and in nice cases, it can be exactly computed using definite integrals. Despite this, it is not immediately clear that a circle has a finite circumference.
Another limiting ancient argument that is used to estimate and define the circumference of a circle and hence calculating terms of \( \pi \) to some desired accuracy since Archimedes was by using inscribed and circumscribed regular polygons. But still, making a precise sense of the circumference of a circle, and hence the number \( \pi \), is a quite subtle matter.
The Limiting Operation:
In Archimedes’ argument, the limiting operation can be formalized by regarding the bottom of the wavy strip (curve) as the graph of a function \(f_n \), and the limiting curve as the graph of a constant function \(f\). Then \( f_n \to f \) uniformly.
The Notion of Area:
The whole of Euclidean Geometry deals with the notions of “areas” and “volumes” for arbitrary objects in \( \mathbb{R}^2 \) and \( \mathbb{R}^3 \) as if they are inherently defined for such objects and merely need to be calculated. The calculation was done by simply cutting the object into finite simple parts and then rearranging them by performing some rigid motion like rotation or translation and then reassembling those parts to form a simpler body which we already know how to compute. This type of Geometry relies on three hidden assumptions:
- Every object has a well-defined area or volume.
- The area or volume of the whole is equal to the sum of the areas or volumes of its parts.
- The area or volume is preserved under such re-arrangments.
This is not automatically true for arbitrary objects; for example consider the Banach-Tarski Paradox. Therefore, proving the existence of a well-defined notion of area for the specific subset describing the circle, and that it is preserved under the subdivision, rearrangement, and the limiting operation considered, is crucial for validating Archimedes’ argument as a full proof of the area formula. Measure Theory addresses these issues by providing a rigorous framework for defining and understanding areas and volumes. Thus, showing 1,3, 4, and the preservation of the area under the limiting operation requires some effort but is achievable through Measure Theory.
Arc Length under Uniform Limits:
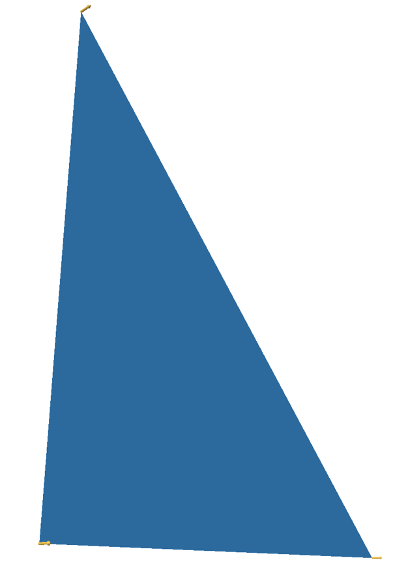
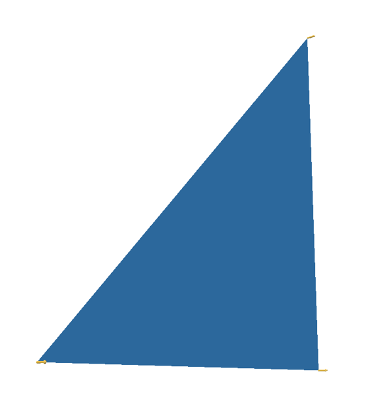
The other part of number 5 is slightly tricky because the arc length is not generally preserved under uniform limits. To illustrate this, consider the staircase curve approximation of the diagonal of a unit square in \( \mathbb{R}^2 \). Even though as the step curves of the staircase get finer and they converge uniformly to the diagonal, their total arc length converges to 2, not to \( \sqrt{2} \). This example demonstrates that arc length, as a function, is not continuous with respect to uniform convergence. However, arc length is preserved under uniform limits if the derivatives of the functions converge uniformly as well. In such cases, uniform convergence of derivatives ensures that the arc length is also preserved in the limit. Is this provable in Archimedes argument? yes with some work.
Moral of the Story:
There is no “obvious” in mathematics. It is important to prove mathematical statements using strict logical arguments from agreed-upon axioms without hidden assumptions, no matter how “intuitively obvious” they seem to us.
“The kind of knowledge which is supported only by
observations and is not yet proved must be carefully
distinguished from the truth; it is gained by induction, as
we usually say. Yet we have seen cases in which mere
induction led to error. Therefore, we should take great
care not to accept as true such properties of the numbers
which we have discovered by observation and which are
supported by induction alone. Indeed, we should use such
a discovery as an opportunity to investigate more exactly
the properties discovered and to prove or disprove them;
in both cases we may learn something useful.”
–L. Euler
“Being a mathematician means that you don’t take ‘obvious’
things for granted but try to reason. Very often you will be
surprised that the most obvious answer is actually wrong.”
–Evgeny Evgenievich
Bibliography
- Strogatz, S. (1270414824). Take It to the Limit. Opinionator. https://archive.nytimes.com/opinionator.blogs.nytimes.com/2010/04/04/take-it-to-the-limit/
- Tao, T. (2011). An introduction to measure theory. Graduate Studies in Mathematics. https://doi.org/10.1090/gsm/126
- Pogorelov, A. (1987). Geometry. MIR Publishers.
- Blackadar, B. (2020). Real Analysis Notes