Categories
Research

Surface Log Maps

by Anja Milutinovic and Shannon Cudworth

Geodesics and geodesic distance

Suppose we have a curved surface M⊂3\mathbb{R}^3. If we want to measure distances or move from one point to another, Euclidean straight lines are no longer appropriate because they leave the surface. So we generalise the notion of a “straight line”, by seeking the straightest possible path that remains on the surface. This is called a geodesic.

More formally, a geodesic is a curve that locally minimizes the length L of the curve:

L(γ)=01γ(t)dt,where γ(t)Tγ(t)M.L(\gamma)=\int_0^1 \|\gamma'(t)\|\,dt,\quad \text{where }\gamma'(t)\in T_{\gamma(t)}M.

The geodesic distance between two points p, q M is:

dM(p,q)=infγ:[0,1]M,γ(0)=p,γ(1)=qL(γ)d_M(p,q)=\inf_{\gamma:[0,1]\to M,\,\gamma(0)=p,\,\gamma(1)=q}L(\gamma)

Exponential and logarithmics maps

Given a point pMp\in M and a tangent vector vTpMv\in T_pM, there exists a unique geodesic γ\gamma such that γ(0)=p\gamma(0)=p and γ(0)=v\gamma'(0)=v. Exponential map Expp:TpMM\operatorname{Exp}_p:T_pM\rightarrow M is a map that for every vTpMv\in T_pM gives the endpoint of the geodesic starting at p with the direction vv and length v\|v\|

Then, the logarithmic map is the inverse of the exponential map,  Logp:MTpM\operatorname{Log}_p:M\rightarrow T_pM, whenever the exponential map is invertible. Logarithmic map for any given point qMq\in M is a tangent vector that gives the initial direction of a geodesic starting at p and ending at q.

Combining the logarithmic map with the frame ϕp:TpM2\phi_p:T_pM\rightarrow\mathbb{R}^2, we get 

z=ϕpLogpz=\phi_p\circ\operatorname{Log}_p, that maps any point q on a surface into 2\mathbb{R}^2.

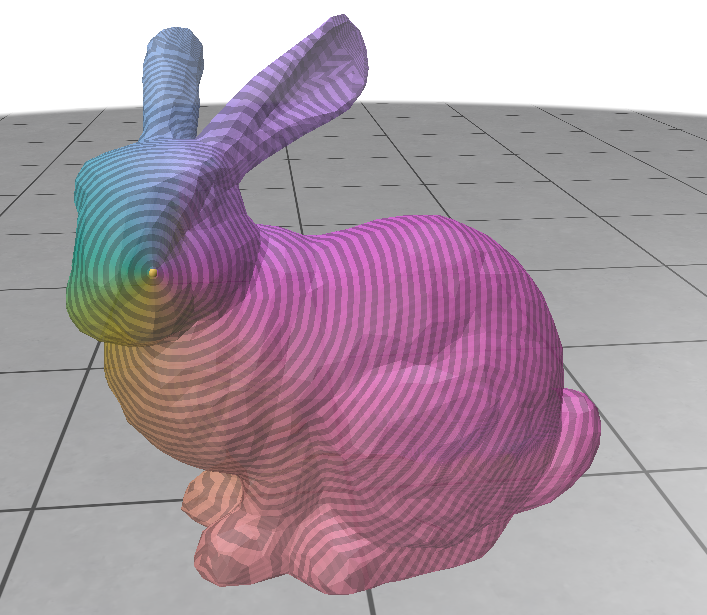
Local parameterization of the Stanford Bunny using a logarithmic map centered at a selected point.

Levi Civita connections

Given two neighboring vertices v1,v2v_1, v_2 on a discrete triangle mesh, we can define corresponding tangent vectors t1,t2,t_1, t_2, such that t1t_1and t2t_2 belong to the tangent planes at v1v_1 and v2,v_2,respectively. Since t1, t2t_1,\ t_2 lie on different tangent planes, we cannot meaningfully compare them. Our goal is to define a parallel transport, which moves one tangent vector to another tangent plane at an adjacent vertex, while minimizing rotation, known as the Levi Civita connection.

To implement the Levi Civita connection, we are given a dictionary containing all vertices with a shared edge, and the normal vector defined at every vertex viv_i. By looping over all shared edges i,ji,j, we take neighboring vertices vi,vjv_i, v_j and we index and define the normal vectors corresponding with the vertices, labeled n1n_1 and n2n_2, respectively.  We then use the normals to calculate the Rodrigues Rotation, or the rotation of a vector by a specific angle around a fixed axis. The formula to determine this rotation matrix is given by:

R=I+vx+vx2×1cs2R = I + v_x + v_x^2 \times \frac{1-c}{s^2}

where v=n1×n2, c=n1n2, s=||v||, 𝐯×=[0v2v1v20v0v1v00]v = n1 \times n2,\ c = n1 \cdot n2, \ s = ||v||, \ \mathbf{v}_{\times}=\left[\begin{array}{ccc}0&-v_2&v_1\\v_2&0&-v_0\\-v_1&v_0&0\end{array}\right]

Then R approximates Levi Civita connection between adjacent tangent planes.

Connection Laplacian

After constructing the Levi Civita connection, we want to compare the tangent vectors at neighboring vertices, which is accomplished through the Connection Laplacian. As before, we loop over all vertices i,j with shared edges, and first define the cotangent weights, which are given by:

wij=12(cotαij+cotβij)w_{ij} = \frac{1}{2}(cot\alpha_{ij} + cot\beta_{ij})

where αij\alpha_{ij} and βij\beta_{ij} are the two angles opposite the edge (i, j). Now we can define the Connection Laplacian matrix, defined as:

Lij={(kN(i)wik)I,amp;i=j,wijRji,amp;(i,j) is an edge,0,amp;otherwise. L_{ij}= \begin{cases} \left(\displaystyle\sum_{k\in N(i)} w_{ik}\right)I, & i=j, \\[1.2ex] -w_{ij}R_{ji}, & (i,j)\text{ is an edge}, \\[0.8ex] 0, & \text{otherwise}. \end{cases}

where wijw_{ij} is the cotangent weight between vertex i and vertex j, RijR_{ij} is the Levi Civita connection between vertex i and vertex j, and N(i)N(i) is the set of adjacent vertices to vertex i. Once the Connection Laplacian is defined, we can now measure how tangent vector fields change across vertices and our mesh.

Heat Diffusion & Vector Heat Method

With the Levi Civita connection and the Connection Laplacian, we can now define the Vector Heat Method (VHM), which approximates parallel transports between arbitrary vertices on our surface.

Given a mass matrix M, a connection laplacian L, an initial vector field V, and a small time step h, we can solve the vector heat equation:

(M+hL)X=V(M + hL)X = V

where X is a vector field that approximates the parallel transport of V along the minimal geodesics.

We now introduce a set of user-selected seed vertices S = { s1, ... ,sks_1,\ … \ , s_k } ⊂V. Via the VHM, we can approximate the parallel transport between any arbitrary seed vertices. Our goal is to extend this to the Affine Heat Method, which will use the VHM estimations of parallel transport between seed frames to optimize a set of tangent frames, allowing adjacent logarithmic maps to be more effectively blended.

Seed graph with optimal frames & UV offset

A single logarithmic map only provides a low-distortion parameterization around one point on the surface. To cover the entire mesh, we choose a small set of seed verticesS={s1,,sk}V,S=\{s_1,\ldots,s_k\}\subseteq V,and compute one logarithmic map around each seed. Each seed defines its own local coordinate system describing the nearby geometry.

Since these maps are computed independently, their coordinate systems are arbitrary. Even if two neighboring maps describe the same part of the surface, one may be rotated relative to the other. Before we try to combine the maps, their orientations must be made consistent.

We therefore associate each seed with a local frame tsTsMt_s \in T_sM. Specifically, we define a linear map Ψs:TsMR2\Psi_s : T_sM \rightarrow \mathbb{R}^2 that maps the local frame to the horizontal axis of the plane.

However, the maps may still be translated.o fix this, we assign each seed a UV offset wsR2w_s\in\mathbb{R}^2. Neighboring logarithmic maps should predict the same relative displacement, leading to the consistency condition:

wsws+Ψs(logs(s)).w_{s’} \approx w_s + \Psi_s\!\left(\log_s(s’)\right).

he UV offsets are then computed by minimizing the disagreement between neighboring seeds.

Blending seed’s log maps

The final step was to combine the local parameterizations into a single global UV map. This involves deciding which local maps influence each part of the surface and how they should be combined. One way to this is to partition the surface into Voronoi cells, where each vertex is assigned to its nearest seed according to geodesic distance and inherits that seed’s local parameterization. While this approach is simple and efficient, it creates visible seams at the boundaries between neighboring cells.
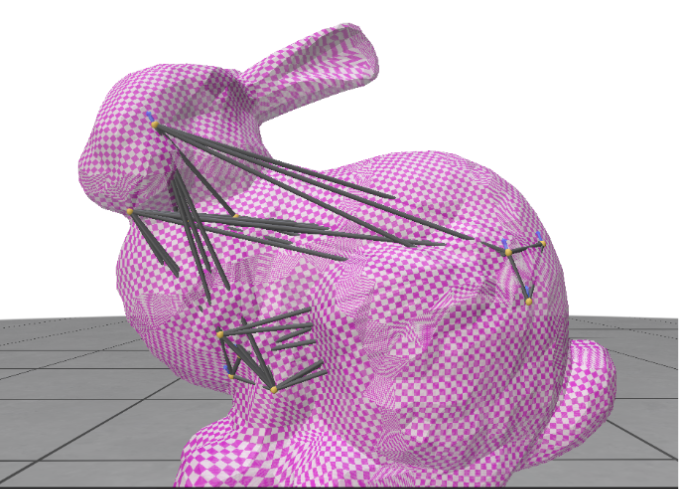
Global UV parameterization of the Stanford Bunny using a Voronoi partition of local logarithmic maps.

Categories
Tutorials

From Discrete Points to Smooth Manifolds: The Elegant Architecture of Geometry Processing

To a layperson, geometry is simply the study of interesting shapes, and geometry processing is the software pipeline that acquires, manipulates, and outputs them. But to researchers, mathematicians, and programmers in computational geometry, a surface represents something far deeper. It is a continuous topological space that is locally homeomorphic to a Euclidean plane. The defining challenge of geometry processing is discretized representation. How do we preserve the continuous, elegant properties of smooth differential geometry within the rigid, discrete confines of computer memory?

Discrete Topology: The Piecewise Approximation of Manifolds

In computer graphics and geometric modeling, we mathematically transition from smooth 1D polylines to 2D surfaces by utilizing triangle meshes. These meshes are piecewise-linear approximations of continuous surfaces. Under the hood, this elegant approximation relies on a surprisingly simple graph-based data structure: the vertex-list-face-list representation.

Rather than storing redundant spatial coordinates for every single polygon, the geometry is split into two clean matrices:

The Vertex List

An n x 3 matrix storing the precise spatial coordinates (xi, yi, zi) of every triangle corner in 3D space:

V = {x1 y1 z1

x2 y2 z2

Xn yn zn }

The Face List

An m x 3 matrix storing the topological connectivity. Each row contains three integer indices that reference the vertex list, defining exactly which three vertices form a triangle face:

F = ( f1,1 f1,2 f1,3

f2,1 f2,2 f2,3

fm,1 fm,2 fm,3 )

By decoupling the spatial geometry (the vertex coordinates) from the topological connectivity (the face indices), a triangle mesh is fundamentally transformed into a graph. This structure is incredibly robust. It allows scientists to build closed 3D topologies, such as a simple tetrahedron, or represent incredibly complex, high-resolution models like the classic Stanford Bunny or Blender’s Suzanne monkey head. In fact, standard exchange formats like .obj store this exact coordinate and index pairing directly.

Defining Functions and Interpreting Fields

Once a surface is represented as a mesh, the next frontier in geometry processing is defining functions over these domains. Mathematically, a function f maps elements from a geometric domain to a codomain, such as mapping points on a 2D surface to real-world scalar values:

f:R² — R, f(x,y) = x² + y²

In practical applications, these functions represent physical properties like temperature distribution, deformation fields, or surface texture coordinates. However, visualizing and analyzing these continuous mathematical fields on a discretized computer screen introduces another layer of complexity: shading and perspective. A critical part of geometry processing is knowing how to interpret these plots, as the choice between flat rendering, smooth Gouraud/Phong shading, and shadow mapping drastically alters our perception of the underlying geometric curvature.

Hands-On Exploration

For researchers looking to prototype algorithms, compute discrete differential operators, or visualize complex functions on manifolds, modern Python ecosystems make these tools highly accessible. Using the gpytoolbox library for geometry operations and polyscope for rich, interactive 3D visualization, you can implement and observe these geometric principles firsthand.

Categories
Tutorials

Connecting the Dots: How Computers Map Geometry Using Polylines

To represent visual shapes and curves digitally, computer systems must translate geometry into structured, machine-readable data. While simply storing a finite set of coordinate points is highly memory-efficient, this method lacks the connectivity information required to define a cohesive shape. By pairing these coordinate points with explicit connectivity instructions and applying linear interpolation, which mathematically draws straight lines between designated point pairs, computers construct a “polyline” that successfully bridges the gap between raw spatial data and continuous geometric forms.

This polyline framework serves as a cornerstone of computational geometry due to its remarkable efficiency and versatility. By breaking complex curves down into simple, straight line segments, polylines are exceptionally easy for graphics cards to store and render rapidly on screen. Furthermore, this linear structure simplifies complex spatial calculations, making it highly efficient for software to query spatial relationships or calculate geometric intersections, such as determining where a path crosses a boundary.
Categories
Administrative

Behind the SGI 2026 Mug

Hello, my name is Oras, and I am the main designer behind the SGI 2026 mug :). I wanted to write a bit about the design process, and to also share some design tidbits that may not be so obvious from the outside.

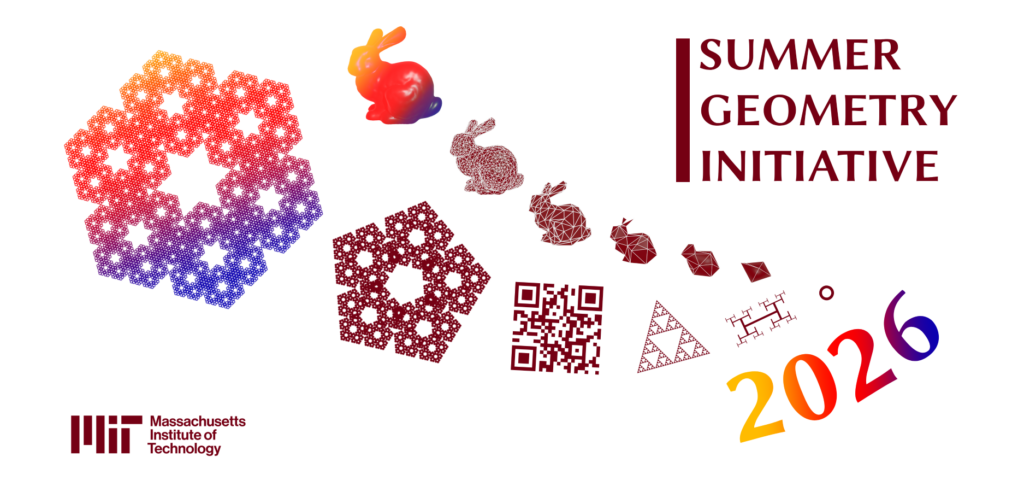
Flat form of the final design, to be wrapped around a mug

One very nice thing about SGI that I have not seen talked about much: because the first iteration of SGI occurred in 2021, the last digit of the year tells us which iteration we are in! (At least, until 2029.) This year, 2026, corresponds to the 6th cohort, so I set out to use the number 6 as often as possible in my design.

SGI as a program is all about geometry. Now, what kind of geometric patterns we can use that look pretty and can incorporate the number 6? The first thing my mind went to was…

The Fractals

Fractals are self-similar patterns, usually generated from a very concise set of predefined rules. Apart from being very mathematical, I also find them incredibly satisfying to look at. Most readers will likely be familiar with the Sierpinski triangle seen in the fractals sequence. A triangle is scaled down, copied three times, and put at the corners of the original triangle. Then you repeat the process.

Sierpinski triangle

But what about the other ones? Turned out, the concept of Sierpinski polygons does actually generalize to any n-gon, and that is what all these shapes are!

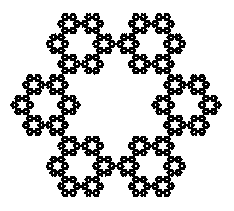
So the choice was obvious: I wanted to feature the Sierpinski hexagon in my design. And what does it look like? Well, not as interesting as its triangle counterpart, as it turned out.

Basic Sierpinski hexagon

It’s not horrible by any means, but I was hoping to use this as the attention grabber, and this variation had more negative space than I would’ve liked. It also looked too regular for my taste. What I like about fractals is the controlled chaos, how it can look locally chaotic yet attains a striking symmetry as a whole.

Turned out, there was a way to mitigate this: a Sierpinski polygon depends on the scaling factor rr. In order for the iterated shape to fit together without overlapping, a specific rr value has to be used, depending on the number of sides. For hexagons, r=13r=\frac{1}{3} is the “correct” ratio.

First iteration of the Sierpinski hexagon visualizing the scaling factor

What happens when we vary rr? We get some pretty interesting results!

Sierpinski hexagon with the scaling factor (r) varying between 1/2 and 1/3

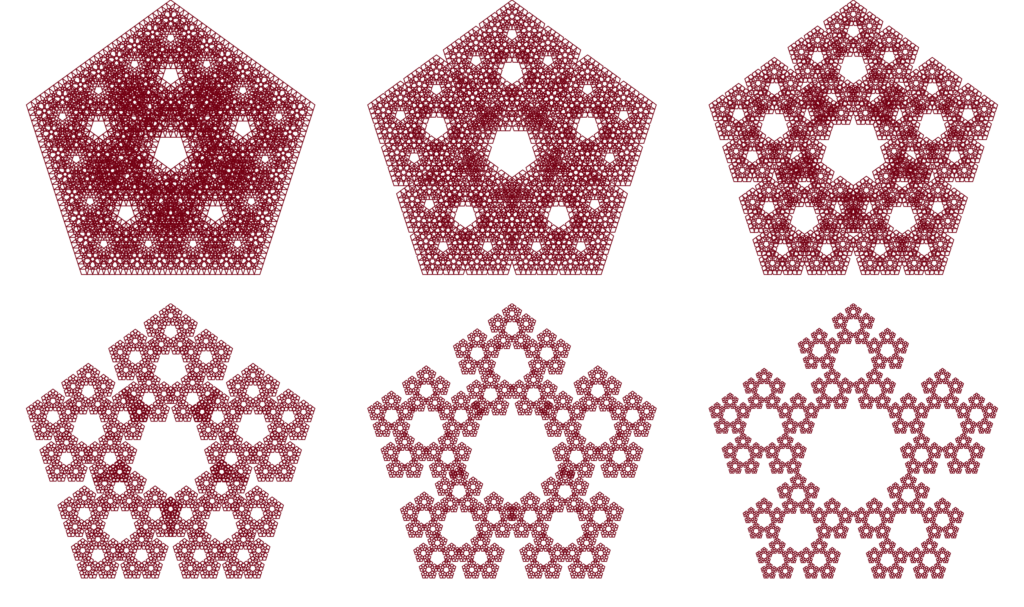
We can also do the same for pentagons, whose “correct” scaling factor is r=11+ϕ12.618r=\frac{1}{1+\phi} \approx \frac{1}{2.618}, where ϕ\phi is the golden ratio

Sierpinski pentagons with scaling factor (r) varying between 1/2 and 1/2.618

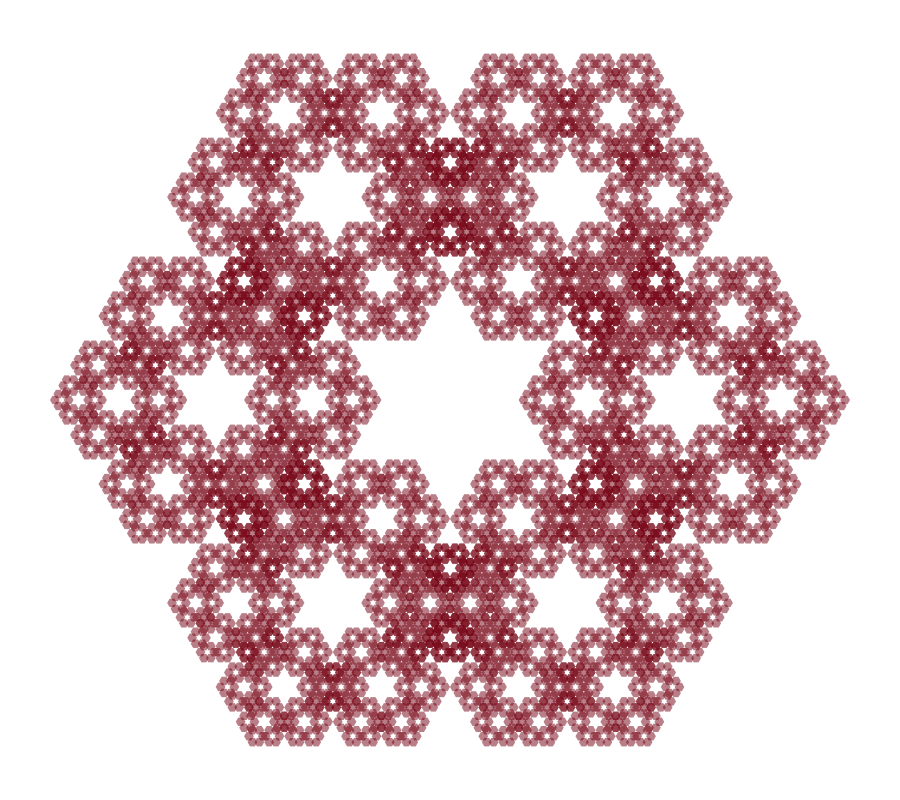
In the end, I just chose an rr value that looked good. For the hexagon, that turned out to be r=11+2r=\frac{1}{1+\sqrt{2}}. I did not realize this at the time, but this was a fairly special value: it was the value that made the corners of the hexagons “touch” at the third iteration. The result: the gaps between hexagons form perfect six-sided stars with sharp points!

(I didn’t realize this at the time, so the pentagon just used a somewhat random value of r12.273r \approx \frac{1}{2.273}. Question for the readers: what would be an equivalent rr for a pentagon?)

Bonus: the six iterations of the Sierpinski hexagon and pentagon

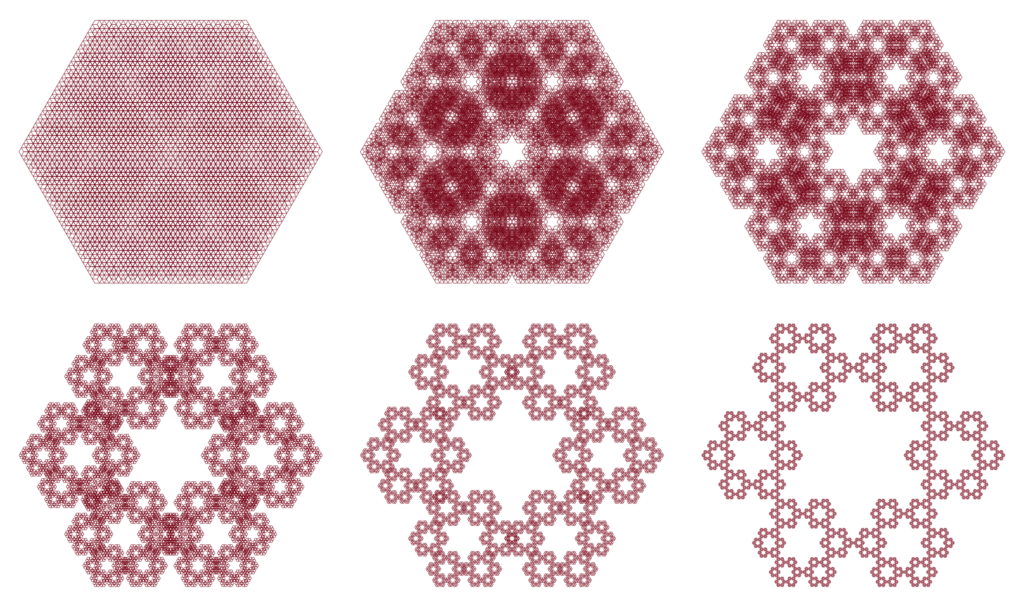
Progression of Sierpinski hexagon from iteration 1 to 6
Progression of Sierpinski pentagon from iteration 1 to 6

And yes, I use 6 iterations for all of the fractals, so there’s another hidden number 6 for you ;).

What About the Other Ones?

I wanted to have a sequence of 6 fractals, symbolizing the iterations of SGI itself, which would increase in sophistication and complexity over time. The Sierpinski triangle was simple enough, but how would I make Sierpinski 2-gon and 1-gon? This took some interpretations

  • For the 1-gon, I decided to treat it as a point, which has no size. So a Sierpinski-type iteration would just product a point. I visualized this with an empty circle, since you technically can’t draw an infinitesimal point on a 2D canvas.
  • I interpreted 2-gon as a line, with the two sides overlapping. Since it also has no area, a Sierpinski 2-gon would also be just a line. To make this more interesting, I decided to create a binary tree instead, which is create from a set of self-similar “I” shapes.
  • Sierpinski square was replaced with a QR code leading to the SGI website ;).
Iterated figure “I” (or maybe short H?) used to represent Sierpinski “2-gon”

Honorable Mentions

I considered a few other fractals to include in the design as well, but ended up going for a simpler design, partially due to time constraint.

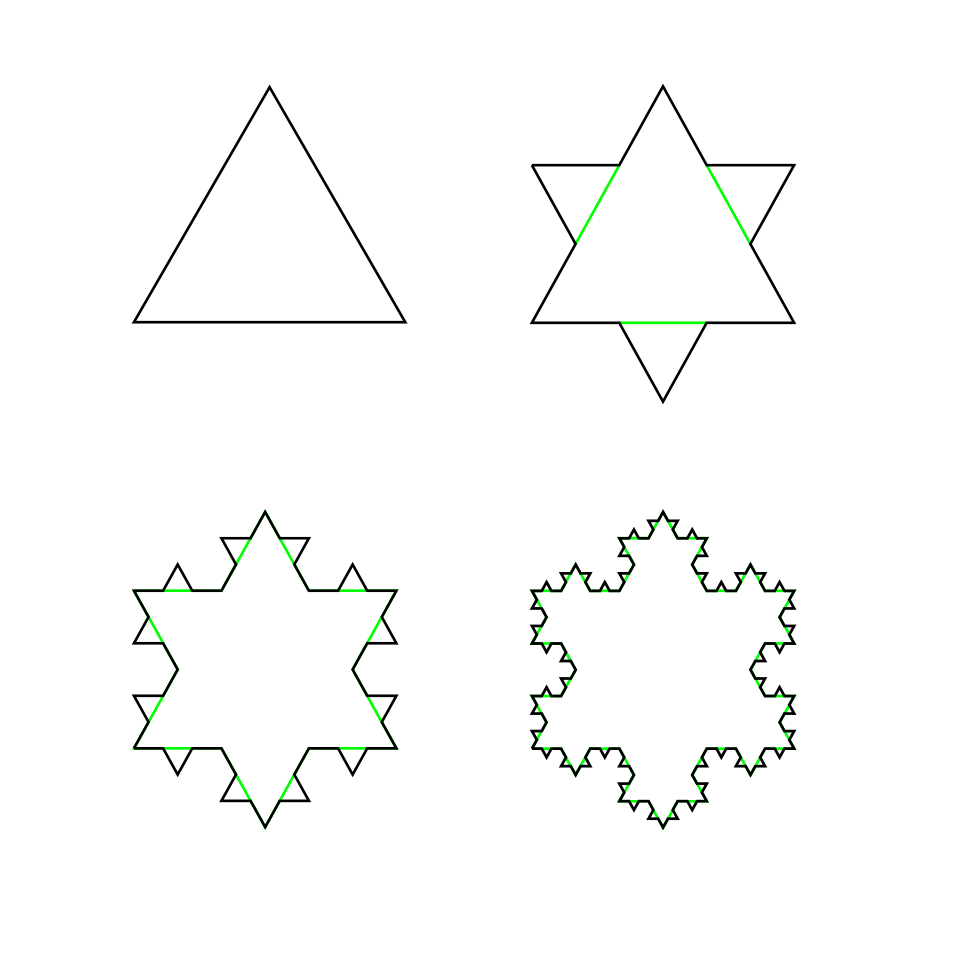
Koch’s Snowflake

4 iterations of Koch’s snowflake

Very iconic, and a natural fit for the number 6. I decided against using it in the end because it was a little too well known, and I wanted a more unique look for our mug.

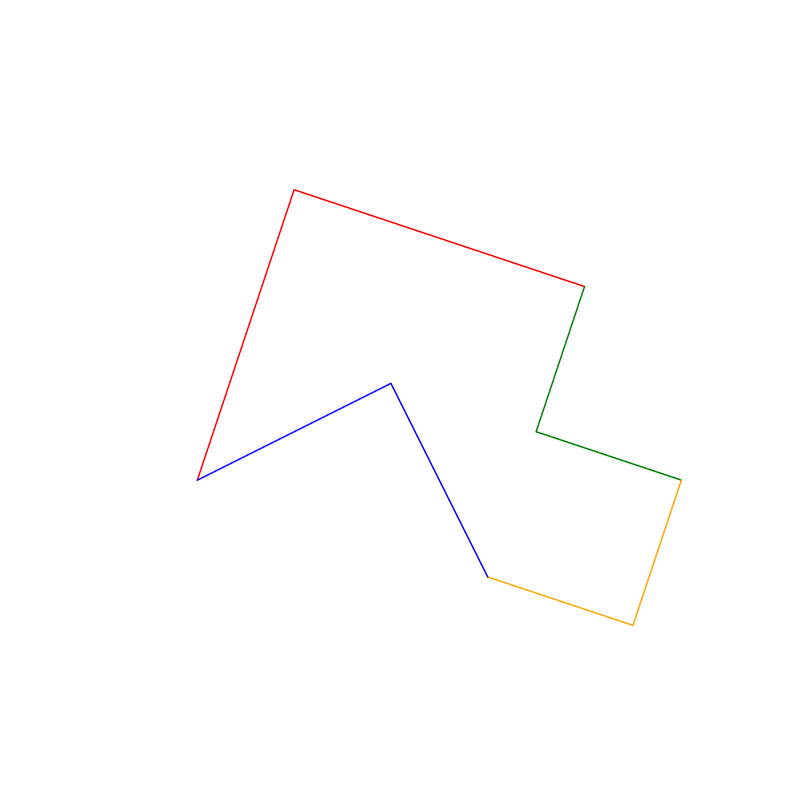
Dragon Curve

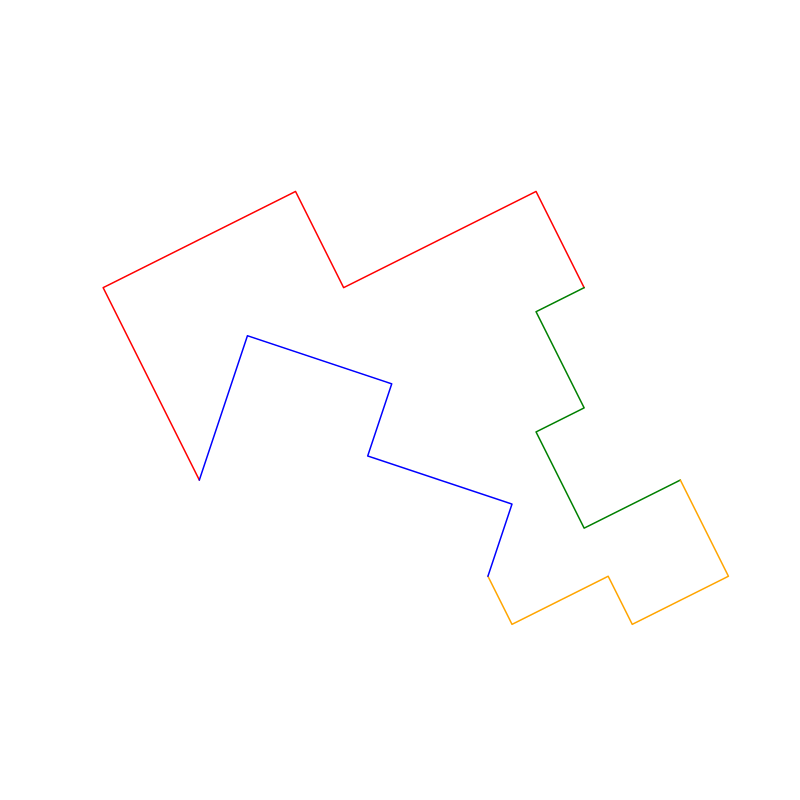
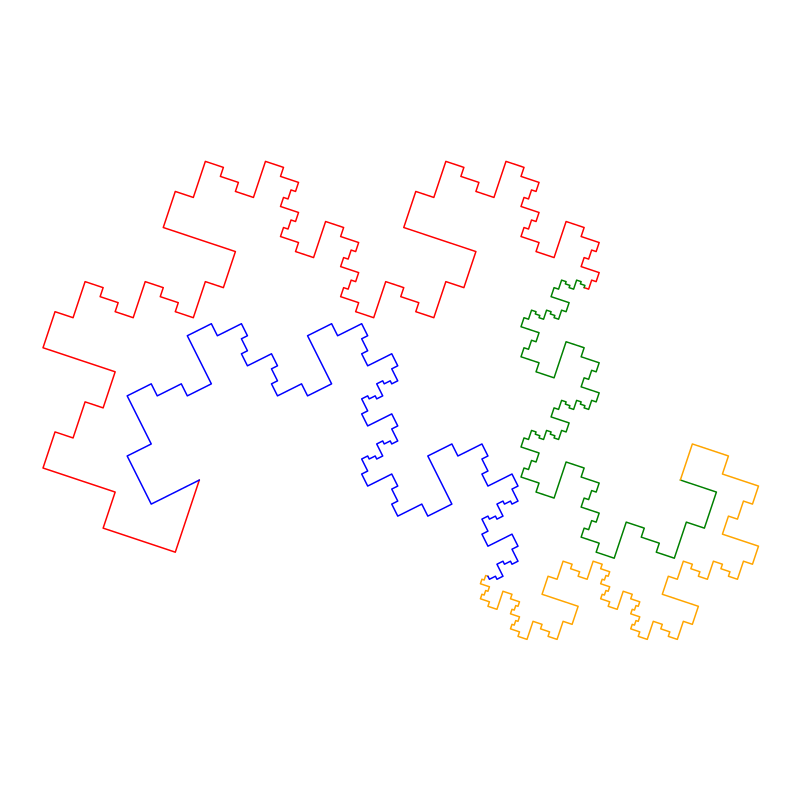
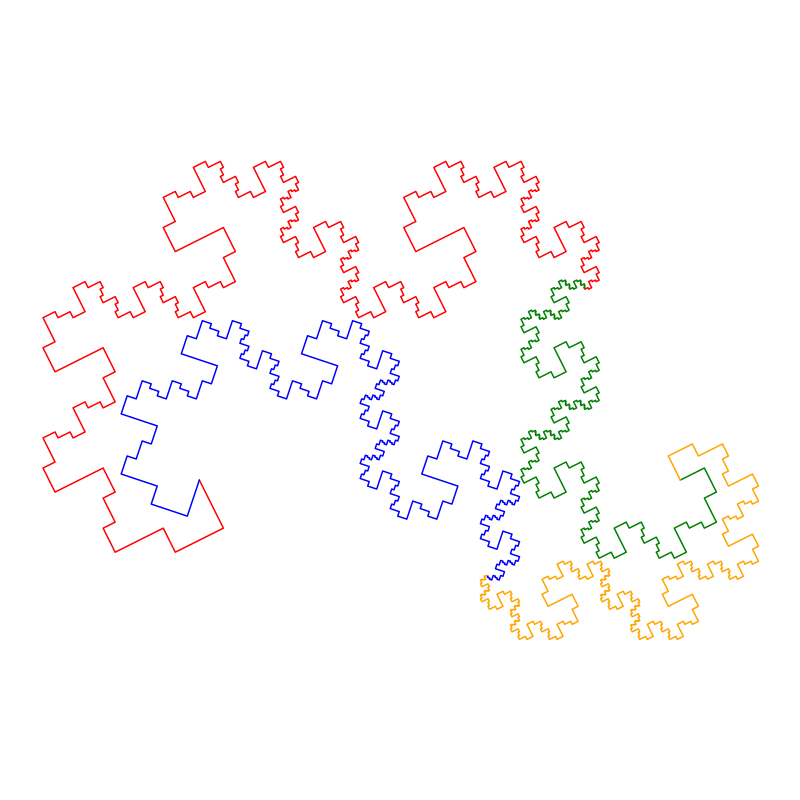
10th iteration of the Dragon curve, illustrating the limit shape

Arguably my favorite fractal of all time, especially for its connection to paper folding. Unfortunately, I couldn’t quite figure out how to incorporate it into the design. And there is also a similar issue of negative space: the interesting parts are at the outline, but the interior is plain.

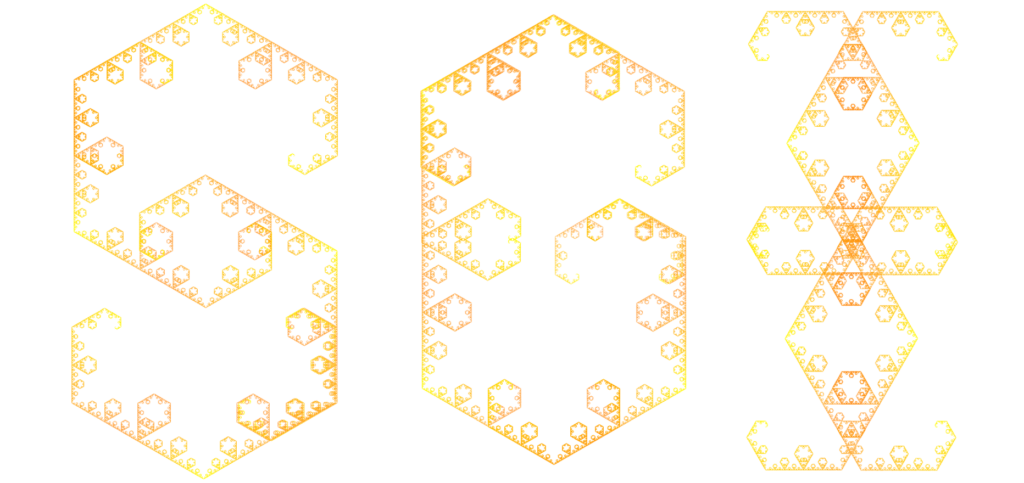
Levy Dragon

Fancy SGI acronym made from a bunch of Levy Dragons

For a while, I really wanted the SGI acronym itself to be a fractal. I ended up playing around the the Levy Dragon, which I arranged into the letters. In the end, I decided it was much too ornate compared to the rest of the design, and did not use it.

Other Mug Designs

There were many other awesome mug designs proposed, most of which served as inspirations for my design!

Gokul S was the first person who proposed a design element in the group chat: a sequence of L-System-based trees. I basically stole the six-fractals-sequence-as-SGI-cohorts from him. I tried really hard to include these trees in my design as well, but unfortunately could not find a good place for them in time :(.

Similarly, Rahim Hossain proposed using levels of decimation of a Stanford Bunny, which I also copied wholesale into my design.

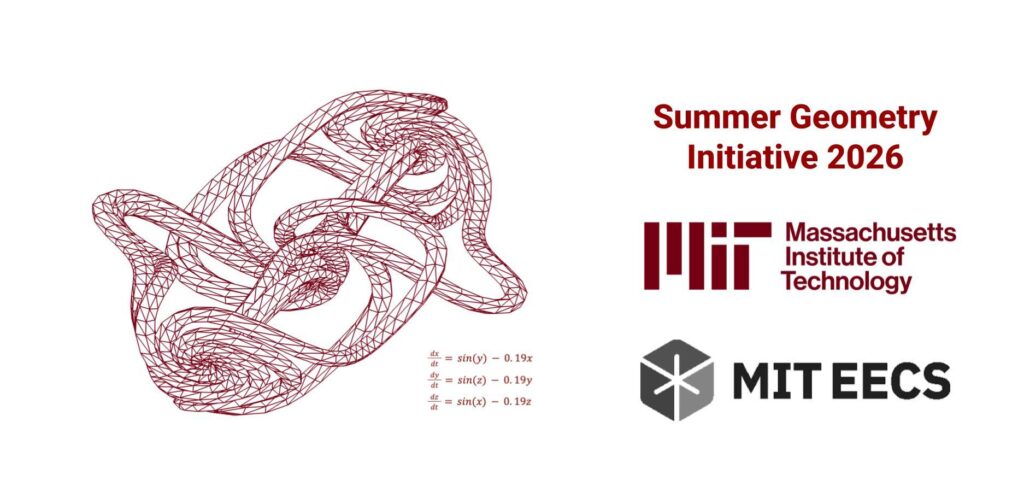
Kyle Loh created this awesome design. In his own words:

[The design] is a continuous-time dynamical system called the Thomas attractor (it is strange and chaotic, by the way).

Finally, Loiruck Godwin proposed a couple of designs, featuring a “grid of bunnies,” and a crystalline cliff that “captures the collaborative nature of SGI, where people of various background’s help each other and work together to climb a geometric mountain of knowledge.”

I would not have been able to push my design as far as I could without these inspirations, and I’m glad I get to at least showcase these designs here, as they deserve to be :).

Final Thoughts

Apparently, a blog post doesn’t feel complete without a concluding section like this, but I also don’t really have a conclusion to offer. So I will just include some tidbits about the design I couldn’t fit elsewhere.

  • The first iteration of the design incorporated a giant number 6. My logic was “if you look at this mug on your shelf from a distance, you’d be able to tell it’s the SGI 6 mug right away!” Turned out, everyone unanimously hated the giant 6 😂. Subsequent design iterations featured the year 2026 of a regular size.
The first iteration of the design with the universally hated giant number 6
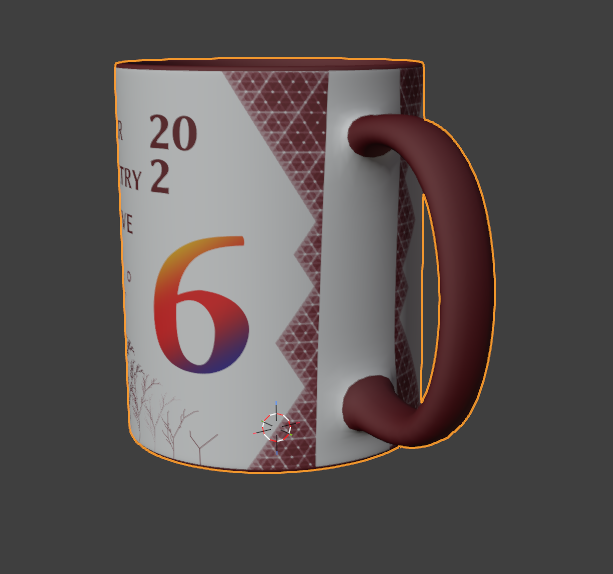
  • One goal I had for the design was it MUST look good wrapped around a mug. Blender was very useful for visualizing this. I downloaded a 3D mesh of a mug from Sketchfab, and learned to manually unwrap the UV for the first time, which was fun :).
3D visualization was how I realized the borders on my original design would have introduced a very harsh edge, and were thus removed in subsequent designs
Categories
Administrative

Welcome to SGI 2026!

Welcome to the official blog of the Summer Geometry Initiative (SGI) 2026, taking place July 6-August 14! I’m Justin Solomon, director of SGI 2026 and PI of the MIT Geometric Data Processing Group.

First launched in 2021, SGI is a completely online program engaging a paid cohort of undergraduate and early master’s students in six weeks of training and research experiences related to applied geometry and geometry processing. SGI Fellows come from all over the globe and represent a wide variety of educational institutions, life/career paths, and fields of interest.

SGI aims to accomplish the following objectives:

  • spark collaboration among students and researchers in geometry processing,
  • launch inter-university research projects in geometry processing involving team members across broad levels of seniority (undergraduate, graduate, faculty, industrial researcher),
  • introduce students to geometry processing research and development, and
  • expand the “pipeline” of students entering geometry processing research.

SGI aims to address a number of challenges and inequities in geometry processing. Not all universities host faculty whose work touches on this emerging field, reducing the cohort of students exposed to this discipline during their undergraduate careers. By giving a broad set of students access to geometry processing research experiences, over the longer term we hope to affect the composition and size of the geometry processing community.

SGI is supported by a worldwide network of volunteers, including faculty, graduate students, and research scientists in geometry and related disciplines. This team supports the SGI Fellows through mentorship, instruction, panel discussions, and several other means.

SGI 2026 is due to start in a few days! Each SGI Fellow will be mailed a box of swag from our many sponsors, a certificate, and a custom-made coffee mug designed by SGI 2026 Fellow Oras Phongpanangam and others.

We’ll kick off next week with tutorials in geometry processing led by Oded Stein (Technion), Silvia Sellán (Columbia University), Nicole Feng (Carnegie Mellon University), Dale Decatur/Richard Liu (University of Chicago), and Nick Sharp (NVIDIA). Then, in the remaining 5 weeks, our Fellows will have the opportunity to participate in multiple short-term (1-2 week) research projects, intended to kick off collaborations that last over the longer term. Check out last year’s SGI blog for examples of the kinds of projects they’ll be working on.

Revisit this blog as the summer progresses for updates on SGI 2026 and to read about the exciting ideas our Fellows are developing in geometry!