Categories
News

Wrapping Up SGI 2021

After six weeks of intensive research and tutorials on applied geometry, we finally are ready to wrap up SGI 2021 and send our Fellows back to their home institutions. Directing this program has been one of the most rewarding experiences of my career, and it has been a pleasure seeing our students advance as scientists, mathematicians, and supportive community members.

SGI’s success is entirely thanks to a huge team of volunteers whose time and energy made the program possible.

Below, I acknowledge the many colleagues who have participated in the planning, leadership, and day-to-day activities of SGI 2021. The sheer length of this list is an inspiring reflection of the supportive community we enjoy in geometry research.

To start, SGI 2021 was only possible with the support of our generous sponsors, whose donations allowed us to offer a stipend to each SGI Fellow commensurate with a summer internship:

SGI was organized over the previous year with guidance from colleagues at a variety of institutions worldwide. A Steering Committee provided opinions and advice throughout the planning process:

Within MIT, several faculty and staff members contributed substantial effort to make the program a success. My team in the Geometric Data Processing (GDP) Group provided advice and volunteer support, from feedback on how to structure the program to hand-packing 72 boxes to ship to our Fellows and volunteers; GDP admin Mieke Moran organized payments and many other key aspects that made the program run smoothly. Our EECS Department Chair Prof. Asu Ozdaglar, AI+D Chair Prof. Antonio Torralba, and CSAIL Director Prof. Daniela Rus advocated for the program and provided support and encouragement as SGI obtained final approval within the MIT administration. CSAIL Assistant Director Carmen Finn provided critical last-minute help to make sure our Fellows were paid on time. Prof. Frédo Durand provided much-needed advice—and allowed me to vent—at several junctures.

SGI 2021 received far more applications than anticipated, and our final cadre of 34 Fellows and 29 additional tutorial week participants was painfully difficult to select. Our admissions committee carefully read all the applications:

The first week of SGI centered around five days of tutorials to get our Fellows up to speed on geometry processing research. Each tutorial day was organized by a different volunteer, who took charge of the content for the entire day and generated valuable course materials we can reuse in the future:

  • Day 1: Dr. Oded Stein (MIT), basic techniques in geometry processing
  • Day 2: Hsueh-Ti (Derek) Liu (University of Toronto) and Jiayi Eris Zhang (University of Toronto and Stanford), shape deformation
  • Day 3: Silvia Sellán (University of Toronto), shape representations
  • Day 4: Michal Edelstein (Technion) and Abhishek Sharma (École Polytechnique), shape correspondence
  • Day 5: Prof. Amir Vaxman (Utrecht University), directional fields

The remaining five weeks of SGI included a host of 1-3 week research projects, each involving experienced mentors working closely with SGI Fellow. Our full list of projects and project mentors is as follows:

  • Dr. Itzik Ben-Shabat: Self-supervised normal estimation using shape implicit neural representation (August 16-August 27)
  • Prof. Mikhail Bessmeltsev and Prof. Ed Chien: Singularity-Free Frame Field Design for Line Drawing Vectorization (July 26-August 6)
  • Dr. Tolga Birdal and Prof. Nina Miolane: Uncertainty Aware 3D Multi-Way Matching via Soft Functional Maps (July 26-August 6)
  • Prof. David Bommes and Dr. Pierre-Alexandre Beaufort: Quadrilateral and hexahedral mesh optimization with locally injective maps (July 26-August 6)
  • Prof. Marcel Campen: Improved 2D Higher-Order Meshing (July 26-July 30)
  • Prof. Keenan Crane: Surface Parameterization via Intrinsic Triangulations (August 9-August 27)
  • Dr. Matheus Gadelha: Learning Classifiers of Parametric Implicit Functions (August 16-August 27)
  • Prof. Lin Gao and Jie Yang: Unsupervised partial symmetry detection for 3D models with geometric deep learning (August 16-August 27)
  • Christian Hafner and Prof. Bernd Bickel: Joints for Elastic Strips (August 9-August 13)
  • Yijiang Huang and Prof. Caitlin Mueller: Design optimization via shape morphing (August 16-August 27)
  • Dr. Xiangru Huang: Moving Object Detection from consecutive LiDAR Point Clouds (August 23-August 27)
  • Prof. Michael Kazhdan: Multigrid on meshes (July 26-July 30)
  • Prof. Paul Kry and Alexander Mercier-Aubin: Incompressible flow on meshes (July 26-August 6)
  • Prof. Kathryn Leonard: 2D shape complexity (July 26-July 30)
  • Prof. David Levin: Optimal Interlocking Parts via Implicit Shape Optimizations (July 26-August 6)
  • Angran Li, Kuanren Qian, and Prof. Yongjie Jessica Zhang: Geometric Modeling for Isogeometric Analysis with Engineering Applications (August 2-August 6)
  • David Palmer: Bayesian Rotation Synchronization (August 2-August 13); Planar-faced and other specialized hexahedral meshes (August 16-August 27)
  • Prof. Jorg Peters (The beauty of) Semi-structured splines (August 9-August 13)
  • Alison Pouplin and Dimitris Kalatzis: Learning projection of hierarchical data with a variational auto-encoder onto the Klein disk (July 26-August 6)
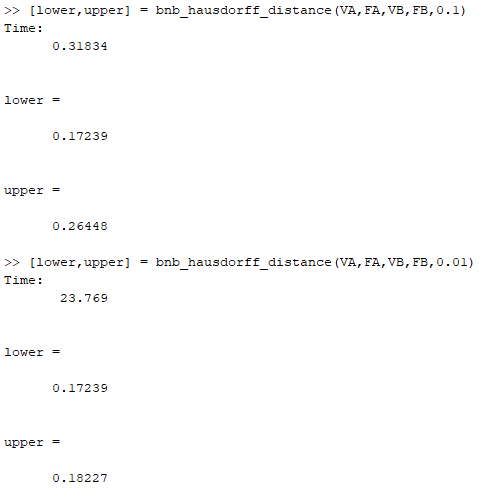
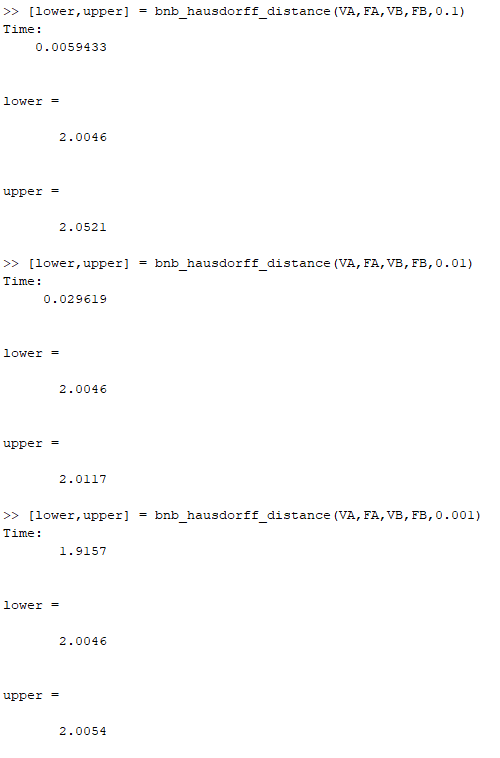
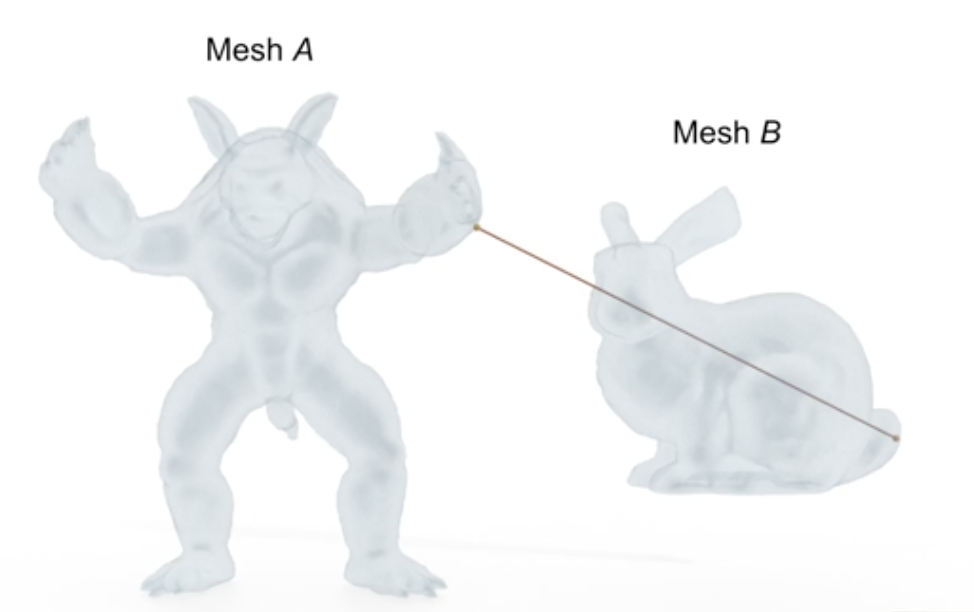
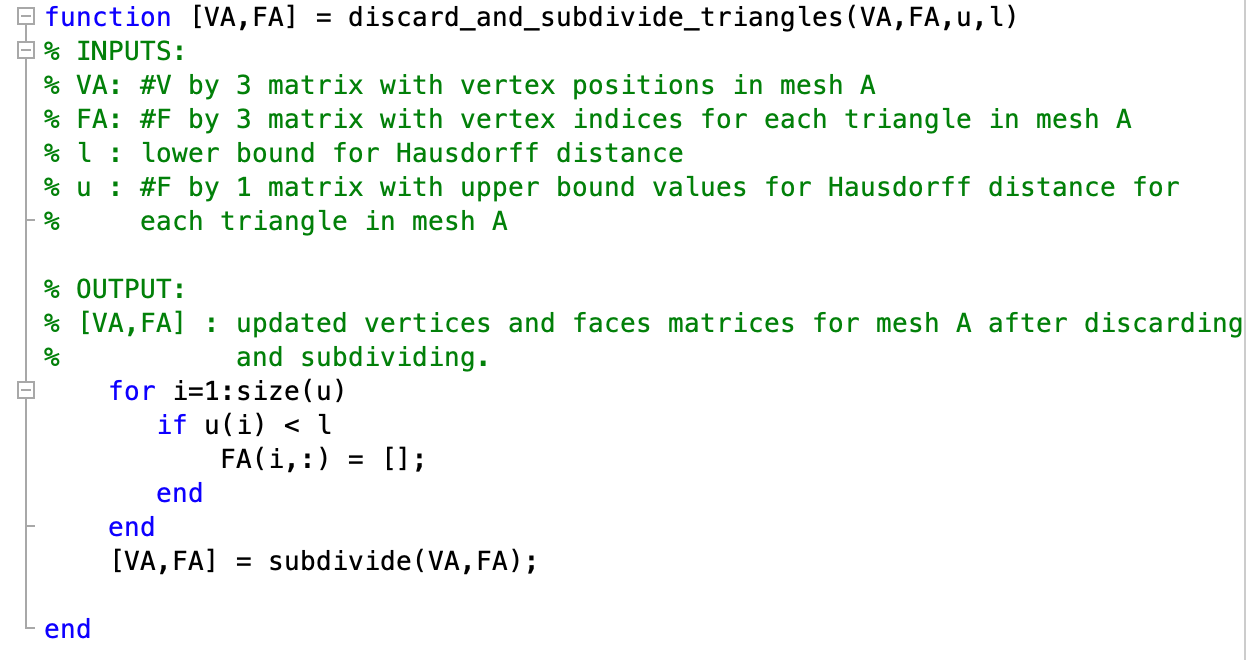
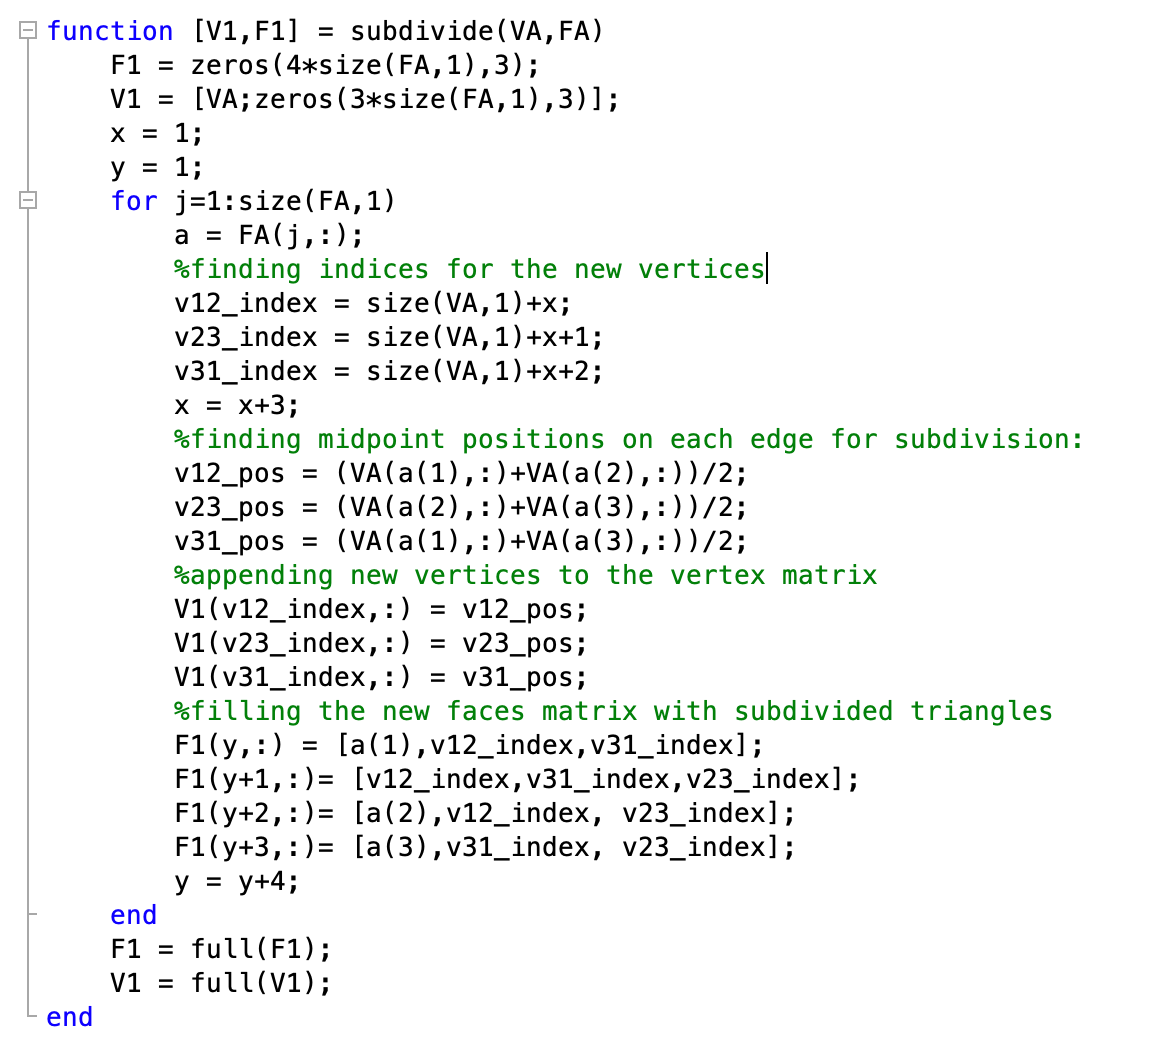
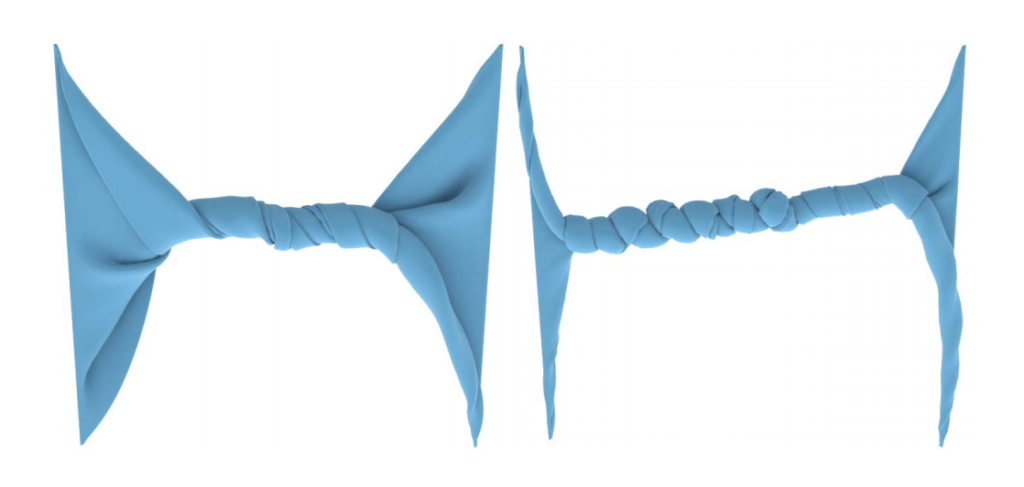
  • Prof. Leonardo Sacht: Robust computation of the Hausdorff distance between triangle meshes (August 9-August 20)
  • Prof. Yusuf Sahillioglu: Cut optimization for parameterization (August 2-August 13)
  • Josua Sassen and Prof. Martin Rumpf: Mesh simplification driven by shell elasticity (August 9-August 20)
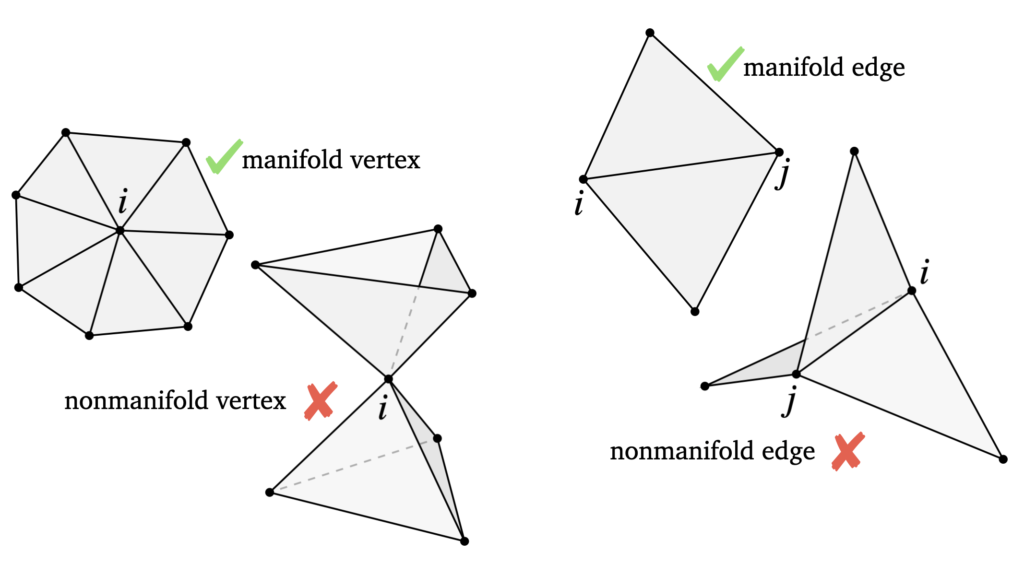
  • Dr. Nicholas Sharp, Prof. Etienne Vouga, Josh Vekhter: Nonmanifold Periodic Minimal Surfaces (August 9-August 27)
  • Dr. Tal Shnitzer-Dery: Self-similarity loss for shape descriptor learning in correspondence problems (August 9-August 13)
  • Dr. Ankita Shukla and Prof. Pavan Turaga: Role of orthogonality in deep representation learning for eco-conservation applications (August 9-August 13)
  • Prof. Noah Snavely: Reconstructing the Moon and Earth in 3D from the World’s Photos (August 9-August 13)
  • Prof. Justin Solomon: Anisotropic Schrödinger Bridges (August 16-August 27)
  • Prof. Marco Tarini: Better Volume-encoded parametrizations (August 2-August 13)
  • Prof. Amir Vaxman: High-order directional field design (July 26-August 6)
  • Prof. Etienne Vouga: Differentiable Remeshing (July 26-August 6)
  • Dr. Stephanie Wang: Discrete Laplacian, area functional, and minimal surfaces (August 16-August 20)
  • Paul Zhang: Classifying hexahedral mesh singular vertices (July 26-August 6); Subdivision Surface Mesh Fitting (August 16-August 27)

An intrepid team of TAs helped our participants learn new topics, refined the tutorial activities, and supported the research projects:

Each week of SGI, we had multiple guest speakers drop by to share their research and experiences, and to give advice to the SGI Fellows:

  • Prof. Katia Bertoldi, Harvard: Multistable inflatable origami from deployable structures to robots
  • Prof. Michael Bronstein, Twitter/Imperial College London: Geometric Deep Learning: the Erlangen Programme of ML
  • Prof. Albert Chern, UCSD: Gauge Theory for Vector Field Design
  • Prof. Bruce Fischl, Harvard/MGH: Geometry and the Human Brain
  • Dr. Fernando de Goes, Pixar: Geometry Processing at Pixar
  • Prof. Rana Hanocka, University of Chicago: Deep Learning on Meshes
  • Prof. Alexandra Ion, Carnegie-Mellon University: Interactive Structures – Materials that can move, walk, compute
  • Prof. Chenfanfu Jiang, UCLA: Developments in smooth optimization contact
  • Prof. Theodore Kim, Yale University: Anti-Racist Graphics Research
  • Prof. Yaron Lipman, Weizmann Institute: Implicit Neural Representations
  • Prof. Mina Konaković Luković, MIT: Transforming Design and Fabrication with Computational Discovery
  • Prof. Lakshminarayanan Mahadevan, Harvard: Folding and cutting paper: art and science
  • Prof. Caitlin Mueller, MIT: Geometry of High-Performance Architecture
  • Prof. Matthias Niessner, TU Munich: Learning to Reconstruct 3D Scenes
  • Íñigo Quílez: Intro to SDFs and Examples
  • Dr. Elissa Ross, Metafold: Periodic geometry: from art to math and back again
  • Dr. Ryan Schmidt, Epic Games and Gradientspace: Geometry Processing in Practice
  • Prof. Tamar Shinar, UC Riverside: Partitioned solid-fluid coupling
  • Prof. Emily Whiting, Boston University: Mechanics-Based Design for Computational Fabrication

Last but not least, incoming MIT PhD student Leticia Mattos Da Silva organized a talk and panel discussion on the graduate school application process, including a Q&A with Silvia Sellán, Jiayi Eris Zhang, and Oded Stein.

The cast of thousands above is a testament to the dedication of the geometry research community to developing a diverse, energetic community of young researchers.

SGI 2021 comes to a close as quietly as it began, as our Fellows and mentors close one final Zoom call and return to their lives scattered over the globe. In the months and years to come, we look forward to keeping in touch as our Fellows become colleagues, collaborators, and leaders of future generations of researchers.

Categories
Demo SGI research projects

Self-similarity loss for shape descriptor learning in correspondence problems

By Faria Huq, Kinjal Parikh,  Lucas Valença

During the 4th week of SGI, we worked closely with Dr. Tal Shnitzer to develop an improved loss function for learning functional maps with robustness to symmetric ambiguity. Our project goal was to modify recent weakly-supervised works that generated deep functional maps to make them handle symmetric correspondences better.

Introduction:

  • Shape correspondence is a task that has various applications in geometry processing, computer graphics, and computer vision – quad mesh transfer, shape interpolation, and object recognition, to name a few. It entails computing a mapping between two objects in a geometric dataset. Several techniques for computing shape correspondence exist – functional maps is one of them. 
  • A functional map is a representation that can map between functions on two shapes’ using their eigenbases or features (or both). Formally, it is the solution to \(\mathrm{arg}\min_{C_{12}}\left\Vert C_{12}F_1-F_2\right\Vert^2\), where \(C_{12}\) is the functional map from shape \(1\) to shape \(2\) and  \(F_1\), \(F_2\) are corresponding functions projected onto the eigenbases of the two shapes, respectively.

Therefore, there is no direct mapping between vertices in a functional map. This concise representation facilitates manipulation and enables efficient inference.

Figure 1: The approach proposed by Sharma and Ovsjanikov may fail on symmetric regions. Notice the hands, which have not been matched correctly due to their symmetric structure.
  • Recently, unsupervised deep learning methods have been developed for learning functional maps. One of the main challenges in such shape correspondence tasks is learning a map that differentiates between shape regions that are similar (due to symmetry). We worked on tackling this challenge.

Background

  • We build upon the state-of-the-art work “Weakly Supervised Deep Functional Map for Shape Matching” by Sharma and Ovsjanikov, which learns shape descriptors from raw 3D data using a PointNet++ architecture. The network’s loss function is based on regularization terms that enforce bijectivity, orthogonality, and Laplacian commutativity.
  • This method is weakly supervised because the input shapes must be equally aligned, i.e., share the same 6DOF pose. This weak supervision is required because PointNet-like feature extractors cannot distinguish between left and right unless the shapes share the same pose.
  • To mitigate the same-pose requirement, we explored adding another component to the loss function Contextual Loss by Mechrez et al. Contextual Loss is high when the network learns a large number of similar features. Otherwise, it is low. This characteristic promotes the learning of global features and can, therefore, work on non-aligned data.

Work

  1. Model architecture overview: As stated above, our basic model architecture is similar to “Weakly Supervised Deep Functional Map for Shape Matching” by Sharma and Ovsjanikov. We use the basic PointNet++ architecture and pass its output through a \(4\)-layer ResNet model. We use the output from ResNet as shape features to compute the functional map. We randomly select \(4000\) vertices and pass them as input to our PointNet++ architecture.
  2. Data augmentation: We randomly rotated the shapes of the input dataset around the “up” axis (in our case, the \(y\) coordinate). Our motivation for introducing data augmentation is to make the learning more robust and less dependent on the data orientation.
  3. Contextual loss: We explored two ways of adding contextual loss as a component:
    1. Self-similarity: Consider a pair of input shapes (\(S_1\), \(S_2\)) of features \(P_1\) with \(P_2\) respectively. We compute our loss function as follows:
      \(L_{CX}(S_1, S_2) = -log(CX(P_1, P_1)) – log(CX(P_2, P_2))\),
      where \(CX(x, y)\) is the contextual similarity between every element of \(x\) and every element of \(y\), considering the context of all features in \(y\).
      More intuitively, the contextual loss is applied on each shape feature with itself (\(P_1\) with \(P_1\) and \(P_2\) with \(P_2\)), thus giving us a measure of ‘self-similarity’ in a weakly-supervised way. This measure will help the network learn unique and better descriptors for each shape, thus alleviating errors from symmetric ambiguities.
    2. Projected features: We also explored another method for employing the contextual loss. First, we project the basis \(B_1\) of \(S_1\) onto \(S_2\), so that \(B_{12} = B_ 1 \cdot C_{12}\). Similarly, \(B_{21} = B_2 \cdot C_{21}\). Note that the initial bases \(B_1\) and \(B_2\) are computed directly from the input shapes. Next, we want the projection \(B_{12}\) to get closer to \(B_2\) (the same applies for \(B_{21}\) and \(B_1\)). Hence, our loss function becomes:
      \(L_{CX}(S_1, S_2) = -log(CX(B_{21}, B_1)) – log(CX(B_{12}, B_2))\).
      Our motivation for applying this loss function is to reduce symmetry error by encouraging our model to map the eigenbases using \(C_{12}\) and \(C_{21}\) more accurately.
  4. Geodesic error: For evaluating our work, we use the metric of average geodesic error between the vertex-pair mappings predicted by our models and the ground truth vertex-pair indices provided with the dataset.

Result

We trained six different models on the FAUST dataset (which contains \(10\) human shapes at the same \(10\) poses each). Our training set includes \(81\) samples, leaving out one full shape (all of its \(10\) poses) and one full pose (so the network never sees any shape doing that pose). These remaining \(19\) inputs are the test set. Additionally, during testing we used ZoomOut by Melzi et al.

ModelData AugmentationContextual Loss
BaseFalseNone
BATrueNone
SSFalseSelf Similarity
SSATrueSelf Similarity
PFFalseProjected Features
PFATrueProjected Features
Table 1: We trained 7 models using the settings described in this table
Figure 2: The AUC (area under curve) curves and values with the average geodesic error for each model.

For qualitative comparison purposes, the following GIF displays a mapping result. Overall, the main noticeable visual differences between our work and the one we based ourselves on appeared when dealing with symmetric body parts (e.g., hands and feet).

Figure 3: Comparison between shape correspondence produced by the models described in Table 1.

Still, as it can be seen, the symmetric body parts remain the less accurate mappings in our work too, meaning there’s still much to improve.

Conclusion

We thoroughly enjoyed working on this project during SGI and are looking forward to investigating this problem further, to which end we will continue to work on this project after the program. We want to extend our deepest gratitude to our mentor, Dr. Tal Shnitzer, for her continuous guidance and patience. None of this would be possible without her.

Thank you for taking the time to read this post. If there are any questions or suggestions, we’re eager to hear them!

Categories
SGI research projects

3D Shape Correspondence via Probabilistic Synchronization of Functional Maps and Riemannian Geometry

By SGI Fellows Faria Huq, Sahra Yusuf and Berna Kabadayi

Over the first 2 weeks of SGI (July 26 – August 6, 2021), we have been working on the “Probabilistic Correspondence Synchronization using Functional Maps” project under the supervision of Nina Miolane and Tolga Birdal with TA Dena Bazazian. In this blog, we motivate and formulate our research questions and present our first results.

Finding a meaningful correspondence between two or more shapes is one of the most fundamental shape analysis tasks. Van Kaick et al (2010) stated the problem as follows: given input shapes \(S_1, S_2,…, S_N\), find a meaningful relation (or mapping) between their elements. Shape correspondence is a crucial building block of many computer vision and biomedical imaging algorithms, ranging from texture transfer in computer graphics to segmentation of anatomical structures in computational medicine. In the literature, shape correspondence has been also referred to as shape matching, shape registration, and shape alignment.

Figure 1: Some application examples where shape correspondence is used. Courtesy: van Kaick, 2010.

In this project, we consider a dataset of 3D shapes and represent the correspondence between any two shapes using the concept of “functional maps” [see section 1]. We then show how the technique of “synchronization” [see section 2] allows us to improve our computations of shape correspondences, i.e., allows us to refine some initial estimates of functional maps. During this project, we implement a method of synchronization using tools from geometric statistics and optimization on a Riemannian manifold describing functional maps, the Stiefel manifold, using the packages geomstats and pymanopt.

1. Representing Shape Correspondences with Functional Maps

Shape correspondence is a well-studied problem that applies to both rigid and non-rigid matching. In the rigid scenario, the transformation between two given 3D shapes can be described by a 3D rotation and a 3D translation. If there is a non-rigid transformation between the two 3D shapes, we can use point-to-point correspondences to model the shape matching. However, as mentioned in Ovsjanikov et al (2012), many practical situations make it either impossible or unnecessary to establish point-to-point correspondences between a pair of shapes, because of inherent shape ambiguities or because the user may only be interested in approximate alignment.  To tackle that problem, functional maps are introduced in Ovsjanikov et al (2012) and can be considered a generalization of point-to-point correspondences.

By definition, a functional map between two shapes is a map between functions defined on these shapes. A function defined on a shape assigns a value to each point of the shape and can be represented as a heatmap on the shape; see Figure 2 for functions defined on a cat and a tiger respectively. Then, the functional map of Figure 2 maps the function defined on the first shape — the cat — to a function on the second shape — the tiger. All in all, instead of computing correspondences between points on the shapes, functional maps compute mappings between functions defined on the shapes.

In practice, the functional map is represented by a \(p \times q\)  matrix, called C. Specifically, we consider p basis functions defined on the source shape (e.g. the cat) and q basis functions defined on the target shape (e.g. the tiger). Typically, we can consider the eigenfunctions of the Laplace-Beltrami operator. The functional map C then represents how each of the p basis functions of the source shape is mapped onto the set of q basis functions of the target shape.

Figure 2: Functional map mapping a function defined on a cat (“source shape”) to a function defined on a tiger (“target shape”). The functional map is represented by a matrix that describes how each of the 20 basis functions chosen on the source shape is mapped onto the set of 20 basis functions chosen on the target shape. (generated using PyFM)

2. Problem Formulation: Synchronization Improves Shape Correspondences

In this section, we describe the technique of “synchronization” that allows us to improve the computations of functional maps between shapes, and we introduce the related notations. We use subsets of the TOSCA dataset (http://tosca.cs.technion.ac.il/book/resources_data.html), which contains a dataset of 3D shapes of cats, to illustrate the concepts.

Intuitively, the method of synchronization builds a graph that links pairs of 3D shapes within the input dataset by edges representing their functional maps; see Figure 3 for an example of such a graph with 4 shapes and 6 edges. The method of synchronization then leverages the property of cycle consistency within the graph. Cycle consistency is a concept that enforces a global agreement among the shape matchings in the graph, by distributing and minimizing the errors to the entire graph — so that not only pairwise relationships are modeled but also global ones. This is why, intuitively, synchronization allows us to refine the functional maps between pairs of shapes by extracting global information over the entire shape dataset.

Let’s now introduce notations to give the mathematical formulation of the synchronization method. We begin with a set of pairwise functional maps,  \(C_{ij} \in \{\mathcal{F}(M_i,M_j)\}_{i,j}\) for \((i,j) \in \varepsilon\). M denotes the set of \(n\) input 3D shapes and \(\varepsilon\) denotes the set of the edges of the directed graph of \(n\) nodes representing the shapes: \(\varepsilon \subset \{1,\dots, n\} \times \{1,\dots, n\}\). We are then interested in finding the underlying “absolute functional maps” \(C_i\) for \(i\in\{1,\dots,n\}\) with respect to a common origin (e.g. \(C_0=I\), the identity matrix) that would respect the consistency of the underlying graph structure. We illustrate these notations in Figure 3. Given a graph of four cat shapes (cat8, cat3, cat9, cat4) and their relative functional maps (C83, C94, C34, C89, C48, C39), we want to find the absolute functional maps (C8, C3, C4, C9).

Figure 3: Synchronization between four shapes from the TOSCA dataset. We are given the functional maps Cij between pairs of shapes (i, j) in the graph. We wish to find the absolute functional map of these shapes: the Ci for each shape i in the graph.

3. Riemannian Optimization Algorithm

In this section, we explain how we frame the synchronization problem as an optimization problem on a Riemannian manifold.

Constraints: As shown by Ovsjanikov et al (2012), functional maps are orthogonal matrices for near-isometry: the columns forming functional map matrix C are orthonormal vectors. Hence, functional maps naturally reside on the Stiefel manifold which is the manifold of matrices with orthonormal columns. The Stiefel manifold can be equipped with a Riemannian geometric structure that is implemented in the packages geomstats and pymanopt. We design a Riemannian optimization algorithm that iterates over the Stiefel manifold (or power manifold of Stiefels) using elementary operations of Riemannian geometry, and converges to our estimates of absolute functional maps. Later, we compare this method to the corresponding non-Riemannian optimization algorithm that does not constrain the iterates to belong to the Stiefel manifold.


Cost function: We describe here the cost function associated with the Riemannian optimization. We want our absolute functional maps to be consistent with the relative maps as much as possible. That is, in the ideal case, \(C_i \cdot C_{ij} = C_j \). To abide by this, we consider the following cost function in our algorithm:

\(\mathop{\mathrm{argmin}} _{{C_i \in \mathcal{F}}} \sum\limits_{(i,j)\in \varepsilon} {{\| C_i \cdot C_{ij} – C_j \|_F}^2 } \)

In this equation, we measure this norm in terms of the Frobenius norm, which is equal to the square root of the sum of the squares of the matrix values. This cost is implemented in Python, as follows:

# Cis are the maps we compute, input_Cijs are the input functional maps
def cost_function(Cis, input_Cijs):
    cost = 0.  
    for edge, Cij in zip(EDGES, input_Cijs):
        i, j = edge
        Ci_Cij = np.matmul(Cis[i], Cij)
        cost += np.linalg.norm(Ci_Cij - Cis[j], "fro") ** 2 
return cost

Optimizer: Our goal is to minimize this cost with respect to the Cis, while constraining the Cis to remain on the Stiefel manifold. For solving our optimization problem, we use the TrustRegion algorithm from the Pymanopt library.

4. Experiments and Results

We present some preliminary results on the TOSCA dataset.

Dataset: For our baseline experiments, we use the 11 cat shapes from the TOSCA dataset. The cats have a wide variety of poses and deformations which make them particularly suitable for our baseline testing.

Initial Functional Map Generation: For each pair of cats within the TOSCA dataset, we compute initial functional maps using state-of-the-art methods, by adapting the source code from here. Our functional maps are of size 20 * 20, i.e they are written in terms of 20 basis functions on the source shape and 20 basis functions on the target shape.

Graph Generation: We implement a random graph generator using networkX that can generate cycle-consistent graphs. We use this graph generator to generate a graph, with nodes corresponding to shapes from a subset of the TOSCA dataset, and with edges depicting the correspondence relationship between the selected shapes. In our future experiments, this graph generator will allow us to compare the performance of our method depending on the number of shapes (or nodes) and the number of known initial correspondences (or initial functional maps) between the shapes (or sparsity of the graph).

Perturbation: We showcase the efficiency of our algorithm by inducing a synthetic perturbation on the initial functional maps and showing how synchronization allows us to correct it. Specifically, we add a Gaussian perturbation to the initial functional maps, with standard deviation s = 0.1, and project the resulting corrupted matrices on the Stiefel manifold to get “corrupted functional maps”. The corrupted functional maps are the inputs of our optimization algorithm.

Results: We demonstrate the result of our optimization algorithm for a subset of the TOSCA dataset and initial (corrupted) functional maps generated with the methods described above: we consider the graph with 4 shapes and 6 edges that was presented in Figure 3. The optimization algorithm converged in less than 20 iterations and less than 1 second. Figure 4 shows the output of our optimization algorithm on this graph. Specifically, we consider a function defined on one of the cats, and map it to the other cats using our functional maps. We can see how efficiently different body parts are being meaningfully mapped in each of these cat shapes.


Figure 4. The absolute functional map output is visualized as point-to-point mapping, The regions marked with the same colors on the four shapes are being mapped to each other (noise standard deviation = 0.1)

Comparison with initially corrupted functional maps: We show how synchronization allows us to improve over our initially corrupted functional maps. Figure 5 shows a comparison between the corrupted functional maps, the ground-truth (un-corrupted) functional maps, and the output functional maps computed via the output absolute maps given by our algorithm, for the correspondence between cat 4 and cat 8. While the algorithm does not allow to fully recover the ground-truth, our analysis shows that it has refined the initially corrupted functional maps. For example, we observe that the noise has been reduced for the off-diagonal elements. This visual inspection is confirmed quantitatively: the distance between the initially corrupted functional maps and the ground-truth is 2.033 while the distance between the output functional maps and the ground-truth is 1.853, as observed in Table 1.

However, the results on the other functional maps C83, C39, C94, C89, C34 are less convincing; see errors reported in Table 1. This can be explained by the fact that we have chosen a relatively small graph, with only 4 nodes i.e. 4 shapes. As a consequence, the synchronization method leveraging cycle consistency can be less efficient. Future results will investigate the performances of our approach for different graphs with different numbers of nodes and different numbers of edges (sparsity of the graph).

Func. Maps.Error C83Error C39Error C48Error C94Error C89Error C34
Before sync.1.7621.6582.0331.8771.8191.854
After sync.1.6592.519 1.7412.3232.1182.492
After sync. (Riem.)2.5762.6211.8531.9842.181 2.519
Table 1. Frobenius norms of the difference between different functional maps and the ground-truth functional maps

Discussion: We compare this method with the method that does not restrict the functional maps to be on the Riemannian Stiefel manifold. We observe similar performances, with a preference for the non-Riemannian optimization method. Future work will investigate which data regimes require optimization with Riemannian constraints and which regimes do not necessarily require it.

Figure 5. Result for the functional map relating cat 4 to cat 8. Left: Corrupted functional maps that are the inputs of our algorithm. Middle: ground-truth functional maps, i.e. functional maps before corruption with synthetic noise. Right: Functional maps given by the output of our algorithm.

Conclusion

In this blog, we explained the first steps of our work on shape correspondences. Currently, we are working on a Markov Chain Monte Carlo (MCMC) implementation to get better results with associated uncertainty quantification. We are also working on a custom gradient function to get better performance. In the coming weeks, we look forward to experimenting with other benchmark datasets and comparing our results with baselines.

Acknowledgment: We thank our mentors, Dr. Nina Miolane and Dr. Tolga Birdal for their consistent guidance and mentorship. They have relentlessly supported us from the beginning, debugged our errors. We especially thank Nina for guiding us to write this blog post. We are very grateful for her keen enthusiasm 😇. We also thank our TA, Dr. Dena Bazazian for her important feedback. 

Source code: See notebook here

Categories
Demo SGI research projects

Minimal Surfaces, But With Saddle Points

By Natasha Diederen, Alice Mehalek, Zhecheng Wang, and Olga Guțan

This week we worked on extending the results described here. We learned an array of new techniques and enhanced existing skills that we had developed the week(s) before. Here is some of the work we have accomplished since the last blog post. 

Tiling

One of the improvements we made was to create a tiling function which created an \( n^3 \) grid of our triply periodic surfaces, so that we were better able to visualise them as a structure. We started off with a surface inside a \( [-1, 1]^3 \) cube, and then imagined an \(n^3\) grid (pictured below). To make a duplicate of the surface in one of these grid cubes, we considered how much the surface would need to be translated in the \(x\), \(y\) and \(z\) directions. For example to duplicate the original surface in the black cube into the green square, we would need to shift all the \(x\)-coordinates in the mesh by two (since the cube is length two in all directions) and leave the \(y\)- and \(z\)-coordinates unchanged. Similarly, to duplicate the original surface into the purple square, we would need to shift the all \(x\)-coordinates in the mesh by two, all the \(y\)-coordinates by two, and all the \(z\)-coordinates by \(2n\).

Figure 1. A visualization of the the surface tiling.

To copy the surface \(n^3\) times into the right grid cubes, we need find all the unique permutations of groups of three vectors chosen from \((0,2,4, \dots, 2n)\) and add them to the vertices matrix of the of the mesh. To update the face data, we add multiples of the number of vertices each time we duplicate into a new cube. 

With this function in place, we can now see our triply periodic surfaces morphing as a larger structure.

Figure 2. A 3x3x3 Tiling of the Surface.

Blender

A skill we continued developing and something we have grown to enjoy, is what we affectionately call “blendering.” To speak in technical terms, we use the open-source software Blender to generate triangle meshes that we, then, use as tests for our code. 

For context: Blender is a free and open-source 3D computer graphics software tool set used for a plethora of purposes, such as creating animated films, 3D printed models, motion graphics, virtual reality, and computer games. It includes many features and it, truly, has endless possibilities. We used one small compartment of it: mesh creation and mesh editing, but we look forward to perhaps experiencing more of its possibilities in the future.

We seek to create shapes that are non-manifold; mathematically, this means that there exist local regions in our surface that are not homeomorphic to a subset of the Euclidean space. In other words, non-manifold shapes contain junctions where more than two faces meet at an edge, or more than two faces meet at a vertex without sharing an edge.

Figure 3. Manifold versus nonmanifold edges and vertices. Source.

This is intellectually intriguing to consider, because most standard geometry processing methods and techniques do not consider this class of shapes. As such, most algorithms and ideas need to be redesigned for non-manifold surfaces. 

Our Blender work consisted of a lot of trial-and-error. None of us had used Blender before, so the learning curve was steep. Yet, despite the occasional frustration, we persevered. With each hour worked, we increased our understanding and expertise, and in the end we were able to generate surfaces we were quite proud of. Most importantly, these triangle meshes have been valuable input for our algorithm and have helped us explore in more detail the differences between manifold and non-manifold surfaces. 

Figure 4. Manifold and Nonmanifold Periodic Surfaces.

Houdini

The new fellows joining this week came from a previous project on minimal surface led by Stephanie Wang, which used Houdini as a basis for generating minimal surfaces. Thus, we decided we could use Houdini to carry out some physical deformations, to see how non-manifold surfaces performed compared to similar manifold surfaces. 

We used a standard Houdini vellum solver with some modifications to simulate a section of our surface falling under gravity. Below are some of the simulations we created.

Figure 5. A Nonmanifold and a Manifold Surface Experiencing Gravity.

Newton’s Method

When we were running Pinkhall and Polthier’s algorithm on our surfaces, we noticed that that algorithm would not stop at a local saddle point such as the Schwarz P surface, but would instead run until there was only a thin strip of area left, which is indeed a minimum, but not a very useful one.

Therefore, we switched to Newton’s Method to solve our optimization problem.

We define the triangle surface area as an energy: let the three vertices of a triangle be \(\mathbf{q}_1\), \(\mathbf{q}_2\), \(\mathbf{q}_3\). Then \(E = \frac{1}{2} \|\mathbf{n}\| \), where \(\mathbf{n} = (\mathbf{q}_2-\mathbf{q}_1) \times (\mathbf{q}_3-\mathbf{q}_1)\) is the surface area normal. Then we derive its Jacobian and Hessian, and construct the Jacobian and Hessian for all faces in the mesh.

However, this optimization scheme still did not converge to the desired minimum, perhaps because our initialization is far from the solution. Additionally, one of our project mentors implemented the approach in C++ and, similarly, no results ensued. Later, we tried to add line search to Newton’s Method, but also no luck.

Although our algorithm still does not converge to some minimal surfaces which we know to exist, it has generated the following fun bugs.

Figure 6.
Figure 7.
Figure 8.

Future Work

In the previous blog post, we discussed studying the physical properties of nonmanifold TPMS. Over the past week, we used the Vellum Solver in Houdini and explored some of the differences in physical properties between manifold and nonmanifold surfaces. However, this is just the beginning — we can continue to expand our work in that direction.

Additional goals may include writing a script to generate many possible initial conditions, then converting the initial conditions into minimal surfaces, either by using the Pinkall and Polthier algorithm, or by implementing another minimal-surface-generating algorithm. 

More work can be done on enumerating all of the possible nonmanifold structures that the Pinkall and Polthier algorithm generates. The researchers can, then, categorize the structures based on their geometric or physical properties. As mentioned last week, this is still an open problem

Acknowledgments

We would like to thank our mentors Etienne Vouga, Nicholas Sharp, and Josh Vekhter for their patient guidance and the numerous hours they spent helping us debug our Matlab code, even when the answers were not immediately obvious to any of us. A special thanks goes to Stephanie Wang, who shared her Houdini expertise with us and, thus, made a lot of our visualizations possible. We would also like to thank our Teaching Assistant Erik Amezquita

Categories
SGI research projects

Robust computation of the Hausdorff distance between triangle meshes

Authors: Bryce Van Ross, Talant Talipov, Deniz Ozbay

The SGI project titled Robust computation of the Hausdorff distance between triangle meshes originally was planned for a 2 week duration, and due to common interest in continuing, was extended to 3 weeks. This research was led by mentor Dr. Leonardo Sacht of the Department of Mathematics of the Federal University of Santa Catarina (UFSC), Brazil. Accompanying support was TA Erik Amezquita, and the project team consisted of SGI fellows, math (under)graduate students, Deniz Ozbay, Talant Talipov, and Bryce Van Ross. Here is an introduction to the idea of our project. The following is a summary of our research and our experiences, regarding computation of the Hausdorff distance. 

Definitions

Given two triangle meshes A, B in , the following are defined:

1-sided Hausdorff distance h: 

$$h(A, B) = \max\{d(x, B) : x\in A\} = \max\{\min\{\|x-y\|: x\in A\}: y\in B\}$$

where d is the Euclidean distance and |x-y| is the Euclidean norm. Note that h, in general, is not symmetric. In this sense, h differs from our intuitive sense of distance, being bidirectional. So, h(B, A) can potentially be a smaller (or larger) distance in contrast to h(A, B). This motivates the need for an absolute Hausdorff distance.

2-sided Hausdorff distance H: 

$$H(A,B) = \max\{h(A, B), h(B, A)\}$$

By definition, H is symmetric. Again, by definition, H depends on h. Thus, to yield accurate distance values for H, we must be confident in our implementation and precision of computing h.

For more mathematical explanation of the Hausdorff distance, please refer to this Wikipedia documentation and this YouTube video.

Motivation

Objects are geometrically complex and so too can their measurements be. There are different ways to compare meshes to each other via a range of geometry processing techniques and geometric properties. Distance is often a common metric of mesh comparison, but the conventional notion of distance is at times limited in scope. See Figures 1 and 2 below.

Figure 1: This distance is limited to the red vertices, ignoring other points of the triangles.
Figure 2: This distance ignores the spatial positions of the triangles. So, the distance is skewed to the points of the triangles, and not the contribution of the space between the triangles.

Figures from the Hausdorff distance between convex polygons. 

Our research focuses on robustly (efficiently, for all possible cases) computing the Hausdorff distance h for pairs of triangular meshes of objects. The Hausdorff distance h is fundamentally a maximum distance among a set of desirable distances between 2 meshes. These desirable distances are minimum distances of all possible vectors resulting from points taken from the first mesh to the second mesh. 

Why is h significant? If h tends to 0, then this implies that our meshes, and the objects they represent, are very similar. Strong similarity indicates minimal change(s) from one mesh to the other, with possible dynamics being a slight deformation, rotation, translation, compression, stretch, etc. However, if h >> 0, then this implies that our meshes, and the objects they represent, are dissimilar. Weak similarity indicates significant change(s) from one mesh to the other, associated with the earlier dynamics. Intuitively, h depends on the strength of ideal correspondence from triangle to triangle, between the meshes. In summary, h serves as a means of calculating the similarity between triangle meshes by maximally separating the meshes according to the collection of all minimum pointwise-mesh distances. 

Applications

The Hausdorff distance can be used for a variety of geometry processing purposes. Primary domains include computer vision, computer graphics, digital fabrication, 3D-printing, and modeling, among others. 

Consider computer vision, an area vital to image processing, having a multitude of technological applications in our daily lives. It is often desirable to identify a best-candidate target relative to some initial mesh template. In reference to the set of points within the template, the Hausdorff distance can be computed for each potential target. The target with the minimum Hausdorff distance would qualify as being the best fit, ideally being a close approximation to the template object. The Hausdorff distance plays a similar role relative to other areas of computer science, engineering, animation, etc. See Figure 3 and 4, below, for a general representation of h.

Figure 3: Hausdorff distance h corresponds to the dotted lined distance of the left image. In the right image, h is found in the black shaded region of the green triangle via the Branch and Bound Method. This image is found in Figure 1 of the initial reading provided by Dr. Leonardo Sacht.
Figure 4: Hausdorff distance h corresponds to the solid lined distance of the left image. This distance is from the furthest “leftmost” point of the first mesh (armadillo) to the closest “leftmost” point of the second mesh. This image is found in Figure 5 of the initial reading provided by Dr. Leonardo Sacht.

Branch and Bound Method

Our goal was to implement the branch-and-bound method for calculating H. The main idea is to calculate the individual upper bounds of Hausdorff distance for each triangle meshes of mesh A and the common lower bound for the whole mesh A. If the upper bound of some triangle is greater than the general lower bound, then this face is discarded and the remaining ones are subdivided. So, we have these 3 main steps:

1. Calculating the lower bound

We define the lower bound as the minimum of the distances from all the vertices of mesh A to mesh B. Firstly, we choose the vertex P on mesh A. Secondly, we compute the distances from point P  to all the faces of mesh B. The actual distance from point P to mesh B is the minimum of the distances that were calculated the step before. For more theoretical details you should check this blog post: http://summergeometry.org/sgi2021/finding-the-lower-bounds-of-the-hausdorff-distance/

The implementation of this part:

Calculating the distance from the point P to each triangle mesh T of mesh B is a very complicated process. So, I would like not to show the code and only describe it. The main features that should be considered during this computation is the position of point P relatively to the triangle T. For example, if the projection of point P on the triangle’s plane lies inside the triangle, then the distance from point P to triangle is just the length of the corresponding normal vector. In the other cases it could be the distance to the closest edge or vertex of triangle T.

During testing this code our team faced the problem: the calculating point-triangle distance takes too much time. So, we created the bounding-sphere idea. Instead of computing the point-triangle distance we decided to compute point-sphere distance, which is very simple. But what sphere should we pick? The first idea that sprung to our minds was the sphere that is generated by a circumscribed circle of the triangle T. But the computation of its center is also complicated. That is why we chose the center of mass M as the center of the sphere and maximal distance from M to each vertex of triangle T. So, if the distance from the point P to this sphere is greater than the actual minimum, then the distance to the corresponding triangle is exactly not the minimum. This trick made our code work approximately 30% faster. This is the realization:

2. Calculating the upper bounds

Overall, the upper bound is derived by the distances between the vertices and  triangle inequality. For more theoretical details you should check this blog post: http://summergeometry.org/sgi2021/upper-bound-for-the-hausdorff-distance/

During testing the code from this page on big meshes our team faced the memory problem. On the grounds that we tried to store the lengths that we already computed, it took too much memory. That is why we decided just compute these length one more time, even though it takes a little bit more time (it is not crucial):

3. Discarding and subdividing

The faces are subdivided in the following way:  we add the midpoints and triangles that are generated by the previous vertices and these new points. In the end, we have 4 new faces instead of the old one. For more theoretical details you should check this blog post: http://summergeometry.org/sgi2021/branch-and-bound-method-for-calculating-hausdorff-distance/

Results

Below are our results for two simple meshes, first one being a sphere mesh and the second one being the simple mesh found in the blog post linked under the “Discarding and subdividing” section.

Figure 5: Results for a sphere mesh with different tolerance levels
Figure 6: Results for a smaller, simple mesh with different tolerance levels

Conclusion

The intuition behind how to determine the Hausdorff distance is relatively simple, however the implementation of computing this distance isn’t trivial. Among the 3 tasks of this Hausdorff distance algorithm (finding the lower bound, finding the upper bound, and finding a triangular subdivision routine), the latter two tasks were dependent on finding the lower bound. We at first thought that the subdivision routine would be the most complicated process, and the lower bound would be the easiest. We were very wrong: the lower bound was actually the most challenging aspect of our code. Finding vertex-vertex distances was the easiest aspect of this computation. Given that in MATLAB triangular meshes are represented as faces of vertex points, it is difficult to identify specific non-vertex points of some triangle. To account for this, we at first used computations dependent on finding a series of normals amongst points. This yielded a functional, albeit slow, algorithm. Upon comparison, the lower bounds computation was the cause of this latency and needed to be improved. At this point, it was a matter of finding a different implementation. It was fun brainstorming with each other about possible ways to do this. It was more fun to consider counterexamples to our initial ideas, and to proceed from there. At a certain point, we incorporated geometric ideas (using the centroid of triangles) and topological ideas (using the closed balls) to find a subset of relevant faces relative to some vertex of the first mesh, instead of having to consider all possible faces of the secondary mesh. Bryce’s part was having to mathematically prove his argument, for it to be correct, but only to find out later it would be not feasible to implement (oh well). Currently, we are trying to resolve bugs, but throughout the entire process we learned a lot, had fun working with each other, and gained a stronger understanding of techniques used within geometry processing.

In conclusion, it was really fascinating to see the connection between the theoretical ideas and the implementation of an algorithm, especially how a theoretically simple algorithm can be very difficult to implement. We were able to learn more about the topological and geometric ideas behind the problem as well as the coding part of the project. We look forward to finding more robust ways to code our algorithm, and learning more about the mathematics behind this seemingly simple measure of the geometric difference between two meshes.

Categories
SGI research projects

Volume-encoded parameterization

by Alice Mehalek, Marcus Vidaurri, and Zhecheng Wang

Background

UV mapping or UV parameterization is the process of mapping a 3D surface to a 2D plane. A UV map assigns every point on the surface to a point on the plane, so that a 2D texture can be applied to a 3D object. A simple example is the representation of the Earth as a 2D map. Because there is no perfect way to project the surface of a globe onto a plane, many different map projections have been made, each with different types and degrees of distortion. Some of these maps use “cuts” or discontinuities to fragment the Earth’s surface.

In computer graphics, the typical method of UV mapping is by representing a 3D object as a triangle mesh and explicitly assigning each vertex on the mesh to a point on the UV plane. This method is slow and must be repeated often, as the same texture map can’t be used by different meshes of the same object.

For any kind of parametrization or UV mapping, a good UV map must be injective and should be conformal (preserving angles) while having few cuts. Ideally it should also be isometric (preserve relative areas). In general, however, more cuts are needed to achieve less distortion.

Volume-encoded parameterization

Our research mentor, Marco Tarini, developed the method of Volume-encoded UV mapping. In this method, a surface is represented by parametric functions and each point on the surface is mapped to a UV position as a function of its 3D position. This is done by enclosing the surface or portion of the surface in a unit cube, or voxel, and assigning UV coordinates to each of the cube’s eight vertices. All other points on the surface can be mapped by trilinear interpolation. Volume-encoded parametrization has the advantage of only needing to store eight sets of UV coordinates per voxel, instead of unique locations of many mesh vertices, and can be applied to different types of surface representations, not just meshes. 

We spent the first week of our research project learning about volume-encoded parametrization by exploring the 2D equivalent: mapping 2D curves to a one-dimensional line, u. Given a curve enclosed within a unit square, our task was to find the u-value for each corner of the square that optimized injectivity, conformality, and orthogonality. We did this using a Least Squares method to solve a linear system consisting of a set of constraints applied to points on the surface. All other points on the curve could then be mapped to u by bilinear interpolation.

A quarter circle (the red curve on the xy plane of the 3D plot) is mapped to a line, u, which is also represented as the height on the z axis in the 3D plot. The surface in the 3D plot is obtained by bilinear interpolation of the height of each corner of the square, and the red curve along the surface represents the path of the quarter circle mapped to 1D.
Each point on the path has a unique height, indicating an injective mapping.

An injective mapping was not possible for portions of a circle greater than a semicircle.
Each point on the path of u does not have a unique height, indicating loss of injectivity. There is also distortion in the middle where the slope is variable.

In Week 2 of the project, we moved on to 3D and created UV maps for portions of a sphere, using a similar method to the 2D case. Some of the questions we wanted to answer were: For what types of surfaces is volume-encoded parametrization possible? At what level of shape complexity is it necessary to introduce cuts, or split up the surface into smaller voxels? In the 2D case, we found that injectivity could be preserved when mapping curves less than half a circle, but there were overlaps for curves greater than a semicircle.

One dimension up, when we go into the 3D space, we found that uniform sampling on the quarter sphere was challenging. Sampling uniformly in the 2D parametric space will result in a distorted sampling that becomes denser when getting closer to the north pole of the sphere. We tried three different approaches: rewriting the parametric equations, sampling in a unit-sphere, and sampling in the 3D target space and then projecting the sample points back to the surface. Unfortunately, all three methods only worked with a certain parametric sphere equation.

When mapping a portion of a sphere to 2D, the grid allows us to see where the mapping is distorted. This mapping is most accurate at the north pole, while areas and angles both become distorted toward the equator.

In conclusion, over the two weeks, we designed and tested a volume-encoded least-squares conformal mapping in both 2D and 3D. In the future, we plan to rewrite the code in C++ and run more experiments.

Categories
Geometry processing Math

When Algorithms Go Wrong

By Natasha Diederen, Sahra Yusuf, and Olga Guțan

I. Introduction

An algorithm is a finite sequence of well-defined, computer-implementable instructions, typically designed to solve a class of specific problems or to perform a computation. Similarly to how we use our brains to (sometimes wrongly) categorize things in order to make sense of the world, a computer needs an algorithm to make sense of what the user is asking it to do. Since an algorithm is a way of communication between two vastly different entities — a human and a machine — some information gets lost along the way. The process is intellectually intriguing to witness, however, problems can arise when we use algorithms to make decisions that influence the lives of humans and other self-aware living beings. 

Algorithms are indispensable for efficiently processing data; therefore they will continue to be part of our programming ecosystem. However, we can (and must) keep some space in our minds for the additional nuances that reality contains. While a programmer may not be able to fully convey these nuances to a computer, we must be aware that no algorithm’s output is final, all-encompassing, and universally true. Furthermore, we must be mindful of the conclusions we draw from the output of algorithms. 

II. Algorithms Gone Wrong

Broadly speaking, potential pitfalls for algorithms are manifold. The issues stem from the nature of the algorithms — a communication tool between a human entity and a nonhuman entity (a computer).  These problems morph into different real-life issues based on what types of algorithms we use and what we use them for. 

Even when playing with algorithms intended to solve toy problems that we already have the answers to, we can notice errors. However, in real life, data is (even) more messy and consequences are far larger. In 2018, Elaine Herzberg was hit and killed by a self-driving taxi. She was jaywalking in the dark with a bicycle by her side and the car alternated between classifying her as a person and a bicycle, thus miscalculating her trajectory and not classifying Elaine as an obstruction. In this case, the safety driver was distracted by a television program, and thus not entirely blameless. However, this serves as an example of how our blind trust in the reliability of algorithms can often result in complacency, with far reaching consequences. 

A further example of error in algorithms is adversarial attacks on neural networks. This is when researchers (or hackers) feed a neural network a modified image, where changes made to the image are imperceptible to the human eye. Nevertheless, this can result in incorrect classification by neural networks, with high confidence to boot. 

Figure 1. A demonstration of fast adversarial example generation applied to GoogLeNet (Szegedy et al., 2014a) on ImageNet. Source.

In Figure 1 we see how by adding an imperceptibly small vector whose elements are equal to the sign of the elements of the gradient of the cost function with respect to the input, we can change GoogLeNet’s classification of the image. Here the \(\epsilon\) of 0.007 corresponds to the magnitude of the smallest bit of an 8 bit image encoding after GoogLeNet’s conversion to real numbers.

Although researchers are working on making neural networks more robust to these sorts of attacks, susceptibility to adversarial attacks seems to be an inherent weakness of deep neural networks. This has serious security implications as computer vision increasingly relies on these models for facial recognition, autonomous vehicles, speech recognition and much more. 

III. Geometry Processing with Imperfect Data

In geometry processing, there is often a need for refinement of geometric data, especially when the data is taken from “real” contexts. Examples of imperfections in 3D models include gaps, self-intersections, and non-manifold geometry, or geometry which cannot exist in reality (e.g. edges included in more than two faces and disconnected vertices).

One common source of imperfect, “real-life” data is 3D object scanning. The resulting models typically include gaps and large self-intersections as a result of incomplete scanning or other error arising from the scanning method. Despite these significant problems, scanned data is still invaluable for rapidly generating assets for use in game development and other applications. During our time at the Summer Geometry Institute, Dr. Matthias Nießner spoke about 3D scene reconstruction with scanned data. His work demonstrated a method of improving the overall quality of reconstructed scenes using bundle adjustment and other techniques. He also worked on solving the problem of incomplete scanned objects using machine learning. Previously, we have written about possible mistakes arising from the weaknesses of machine learning, but Dr. Nießner’s work demonstrates that machine learning is a valuable tool for refining data and eliminating mistakes as well.

Although error in geometry processing is not as frequently discussed, the implications are just as important as those of mistakes arising from the use of machine learning. This is primarily due to the fact that machine learning and geometry processing are not isolated fields or tools, but are often used together, especially in the sorts of situations we described earlier. By researching and developing new methods of data refinement, we can improve the usability of natural data and increase, for example, the safety of systems which rely on visual data.

IV. Human Error and Bias

The errors we have discussed so far exclude human error and bias, which can aggravate existing inequalities in society. For example, a Fellow one of us worked with during SGI mentioned how he worked on a project which used face tracking to animate digital characters. However, the state-of-the-art trackers only worked on him (a white male) and could not track eye or mouth movement for those in his team of black descent. Additionally, as we heard from Theodore Kim in another brilliant SGI talk, animation is focused on designing white skin and non-type 4 hair, further highlighting the systemic racism present in society.

Moreover, the fact that 94.8% of Automatic Gender Recognition (AGR) papers recognize gender as binary has huge implications for the misgendering of trans people. This could lead to issues with AGR based access control for things like public bathrooms, where transgender people may be excluded from both male and female facilities. The combination of machine and human error is especially dangerous, and it is important to recognize this, so that we can mitigate against the worst harm.

V. Conclusion

Algorithms have become a fundamental part of human existence, however our blind faith that algorithms are always (1) correct and (2) unbiased is deeply flawed. The world is a complicated place, with far too much data for computers to handle, placing a strong reliance on simplification algorithms. 

As we have seen from the examples above, these algorithms are far from perfect and can sometimes erase or distort important data. This does not mean we should stop using algorithms entirely. What this does, however, mean is that we must employ a hearty dose of critical thinking and skepticism when analyzing results outputted by an algorithm. We must be especially careful if we use these results for making decisions that would influence the lives of other humans. 

Categories
SGI research projects

Intrinsic Parameterization: Weeks 1-2

By Joana Portmann, Tal Rastopchin, and Sahra Yusuf.
Mentored by Professor Keenan Crane.

Intrinsic parameterization

During these last two weeks, we explored intrinsic encoding of triangle meshes. As an introduction to this new topic, we wrote a very simple algorithm that lays out a triangle mesh flat. We then improved this algorithm via line search over a week. In connection with this, we looked into terms like ‘angle defects,’ ‘cotangent weights,’ and the ‘cotangent Laplacian’ in preparation for more current research during the week.

From intrinsic to extrinsic parameterization

To get a short introduction into intrinsic parameterization and its applications, I quote some sentences from Keenan’s course. If you’re interested in the subject I can recommend the course notes “Geometry Processing with Intrinsic Triangulations.” “As triangle meshes are a basic representation for 3D geometry, playing the same central role as pixel arrays in image processing, even seemingly small shifts in the way we think about triangle meshes can have major consequences for a wide variety of applications. Instead of thinking about a triangle as a collection of vertex positions in \(\mathbb{R}^n\) from the intrinsic perspective, it’s a collection of edge lengths associated with edges.” 

Many properties of a surface such as the shortest path do only depend on local measurements such as angles and distances along the surfaces and do not depend on how the surface is embedded in space (e.g. vertex positions in \(\mathbb{R}^n\)), so an intrinsic representation of the mesh works fine. Intrinsic triangulations bring several deep ideas from topology and differential geometry into a discrete, computational setting. And the framework of intrinsic triangulations is particularly useful for improving the robustness of existing algorithms.

Laying out edge lengths in the plane

Our first task was to implement a simple algorithm that uses intrinsic edge lengths and a breadth-first search to flatten a triangle mesh onto the plane. The key idea driving this algorithm is that given just a triangle’s edge lengths we can use the law of cosines to compute its internal angles. Given a triangle in the plane we can use the internal angles to flatten out its neighbors into the plane. We will later use these angles to modify the edge lengths so that we “better” flatten the model. The algorithm works by choosing some root triangle and then performing a breadth-first traversal to flatten each of the adjacent triangles into the plane until we have visited every triangle in the mesh.

Breadth-first search pseudocode

Some initial geometry central pseudocode for this breadth first search looks something like

// Pick and flatten some starting triangle
Face rootTriangle = mesh->face(0);

// Calculate the root triangle’s flattened vertex positions
calculateFlatVertices(rootTriangle);

// Initialize a map encoding visited faces
FaceData<bool> isVisited(*mesh, false);

// Initialize a queue for the BFS
std::queue<Face> visited;

// Mark the root triangle as visited and pop it into the queue
isVisited[rootTriangle] = true;
visited.push(rootTriangle);

// While our queue is not empty
while(!visited.empty())
{
    // Pop the current Face off the front of the queue
    Face currentFace = visited.front();
    visited.pop();

    // Visit the adjacent faces
    For (Face adjFace : currentFace.adjacentFaces()) {
        // If we have not already visited the face
        if (!visited[adjFace]
            // Calculate the triangle’s flattened vertex positions
            calculateFlatVertices(adjFace);
            // And push it onto the queue
            visited.push(adjFace);
        }
    }
}

In order to make sure we lay down adjacent triangles with respect to the computed flattened plane coordinates of their parent triangle we need to know exactly how a child triangle connects to its parent triangle. Specifically, we need to know which edge is shared by the parent and child triangle and which point belongs to the child triangle but not the parent triangle. One way we could retrieve this information is by computing the set difference between the vertices belonging to the parent triangle and child triangle, all while carefully keeping track of vertex indices and edge orientation. This certainly works, however, it can be cumbersome to write a brute force combinatorial helper method for each unique mesh element traversal routine.

The halfedge mesh data structure

Professor Keenan Crane explained that a popular mesh data structure that allows a scientist to conveniently implement mesh traversal routines is that of the halfedge mesh. At its core a halfedge mesh encodes the connectivity information of a combinatorial surface by keeping track of a set of halfedges and the two connectivity functions known as twin and next. Here the set of halfedges are none other than the directed edges obtained from an oriented triangle mesh. The twin function takes a halfedge and brings it to its corresponding oppositely oriented twin halfedge. In this fashion, if we apply the twin function to some halfedge twice we get the same initial halfedge back. The next function takes a halfedge and brings it to the next halfedge in the current triangle. In this fashion if we take  the next function and apply it to a halfedge belonging to a triangle three times, we get the same initial halfedge back.

A diagram depicting the halfedge data structure connectivity relationships. Source.

Professor Keenan Crane has a well written introduction to the halfedge data structure in section 2.5 of his course notes on Discrete Differential Geometry.

It turns out that geometry central uses the halfedge mesh data structure and so we can rewrite the traversal of the adjacent faces loop to more easily retrieve our desired connectivity information. In the geometry central implementation, every mesh element (vertex, edge, face, etc.) contains a reference to a halfedge, and vice versa.

// Pop the current Face off the front of the queue
Face currentFace = visited.front();
visited.pop();

// Get the face’s halfedge
Halfedge currentHalfedge = currentFace.halfedge();

// Visit the adjacent faces
do
{
    // Get the current adjacent face
    Face adjFace = currentHalfedge.twin().face();
    if (!isVisited[adjFace])
    {
        // Retrieve our desired vertices
        Vertex a = currentHalfedge.vertex();
        Vertex b = currentHalfedge.next().vertex();
        Vertex c = currentHalfedge.twin().next().next().vertex();

        // Calculate the triangle’s flattened vertex positions
        calculateFlatVertices(a, b, c);
        // And push it onto the queue
        visited.push(adjFace);
    }
    // Iterate to the next halfedge
    currentHalfEdge = currentHalfEdge.next();
}
// Exit the loop when we reach our starting halfedge
while (currentHalfEdge != currentFace.halfedge());

Here’s a diagram illustrating the relationship between the currentHalfedge and vertices a, b, and c.

A diagram illustrating the connectivity relationship between the currentHalfedge and vertices a, b, and c. Note that cH abbreviates currentHalfedge.

Segfaults, debugging, and ghost faces

This all looks great right? Now we need to determine the specifics of calculating the flat vertices? Well, not exactly. When we were running a version of this code in which we attempted to visualize the resulting breadth-first traversal we encountered several random segfaults. When Sahra ran a debugger (shout out to GDB and LLDB 🥰) we learned that the culprit was the isVisited[adjFace]  function call on the line

if (!isVisited[adjFace])

We were very confused as to why we would be getting a segfault while trying to retrieve the value corresponding to the key adjFace contained in the map FaceData<bool> isVisited. Sahra inspected the contents of the adjFace object and observed that it had index 248 whereas the mesh we were testing the breadth-first search on only had 247 faces. Because C++ zero indexes its elements, this means we somehow retrieved a face with index out of range by 2! How could this have happened? How did we retrieve that face in the first place? Looking at the lines

// Get the current adjacent face
Face adjFace = currentHalfedge.twin().face();

we realized that we made an unsafe assumption about currentHalfedge. In particular, we assumed that it was not a boundary edge. What does the twin of a boundary halfedge that has no real twin look like? If the issue we were running to was that the currentHalfedge was a boundary halfedge, why didn’t we get a segfault on simply currentHalfedge.twin()? Doing some research, we found that the geometry central internals documentation explains that

“We can implicitly encode the twin() relationship by storing twinned halfedges adjacent to one another– that is, the twin of an even-numbered halfedge numbered he is he+1, and the twin of and odd-numbered halfedge is he-1.”

Geometry central internals documentation

Aha! This explains exactly why currentHalfedge.twin() still works on a boundary halfedge; behind the scenes, it is just adding or subtracting one to the halfedge’s index. Where did the face index come from? We’re still unsure, but we realized that the face currentHalfedge.twin().face() only makes sense (and hence can only be used as a key for the visited map) when currentHalfedge is not a boundary halfedge. Here is a diagram of the “ghost face” that we think the line Face adjFace = currentHalfedge.twin().face() was producing.

A diagram depicting how taking the face of the twin of a boundary halfedge produces a nonexistent face.

Changing the map access line in the if statement to

if (!currentHalfedge.edge().isBoundary() && !isVisited[adjFace])

resolved the segfaults and produced a working breadth-first traversal.

Conformal parameterization

Here is a picture illustrating applying the flattening algorithm to a model of a cat head.

A picture illustrating the application of the flattening algorithm to a model of a cat head.

You can see that there are many cracks and this is because the model of the cat head is not flat—in particular, it has vertices with nonzero angle defect. A vertex angle defect for a given vertex is equal to the difference between \(2 \pi\) and the sum of the corner angles containing that vertex. This is a good measure of how flat a vertex is because for a perfectly flat vertex, all angles surrounding it will sum to \(2 \pi\).

After laying out the edges on the plane \(z=0\), we began the necessary steps to compute a conformal flattening (an angle-preserving parameterization). In order to complete this step, we needed to find a set of new edge lengths which would both be related to the original ones by a scale factor and minimize the angle defects,

\(l_{ij} := \sqrt{ \phi_i \phi_j} l_{ij}^0, \quad \forall ij \in E\),

where where \(l_{ij}\) is the new intrinsic edge length, \(\phi_i, \phi_j\) are the scale factors at vertices \(i, j\), and \(l_{ij}^0\) is the initial edge length.

Discrete Yamabe flow

At this stage, we have a clear goal: to optimize the scale factors in order to scale the edge lengths and minimize the angle defects across the mesh (i.e. fully flatten the mesh). From here, we use the discrete Yamabe flow to meet both of these requirements. Before implementing this algorithm, we began by substituting the scale factors with their logarithms

\(l_{ij} = e^{(u_i + u_j)/2} l_{ij}^0\),

where \(l_{ij}\) is the new intrinsic edge length, \(u_i, u_j\) are the scale factors at vertices \(i, j\), and \(l_{ij}^0\) is the initial edge length. This ensures the new intrinsic edge lengths are always positive and that the optimization is convex.

To implement the algorithm, we followed this procedure:

1. Calculate the initial edge lengths

2. While all angle defects are below a certain threshold epsilon:

  • Compute the scaled edge lengths
  • Compute the current angle defects based on the new interior angles based on the scaled edge lengths
  • Update the scale factors using the step and the angle defects:

\(u_i \leftarrow u_i – h \Omega _i\),

where \(u_i\) is the scale factor of the \(i\)th vertex, \(h\) is the gradient descent step size, and \(\Omega_i\) is the intrinsic angle defect at the \(i\)th vertex.

After running this algorithm and displaying the result, we found that we were able to obtain a perfect conformal flattening of the input mesh (there were no cracks!). There was one issue, however: we needed to manually choose a step size that would work well for the chosen epsilon value. Our next step was to extend our current algorithm by implementing a backtracking line search which would change the step size based on the energy.

Results

Here are two videos demonstrating the Yamabe flow algorithm. The first video illustrates how each iteration of the flow improves the flattened mesh and the second video illustrates how that translates into UV coordinates for texture mapping. We are really happy with how these turned out!

A video visualizing intermediate 2D parameterizations produced by the Yamabe flow.
A video visualizing the intermediate UV coordinates on the cat head mesh produced by the Yamabe flow

Line search

To implement this, we added a sub-loop to our existing Yamabe flow procedure which repeatedly test smaller step sizes until one is found which will decrease the energy, e.g., backtracking line search. A good resource on this topic is Stephen Boyd, Stephen P Boyd, and Lieven Vandenberghe. Convex optimization. Cambridge university press, 2004. After resolving a bug in which our step size would stall at very small values with no progress, we were successful in implementing this line search. Now, a large step size could be given without missing the minima.

Newton’s method

Next, we worked on using Newton’s method to improve the descent direction by changing the gradient to more easily reach the minimum. To complete this, we needed to calculate the Hessian — in this case, the Hessian of the discrete conformal energy was the cotan-Laplace matrix \(L\). This matrix had square dimensions (the number of rows and the number of columns was equal to the number of interior vertices) and has off-diagonal entries:

\(L_{ij} = -\frac{1}{2} (\cot \theta_k ^{ij} + \cot \theta _k ^{ji})\)

for each edge \(ij\), as well as diagonal entries

\(L_{ii} = – \sum _{ij} L_{ij}\)

for each edge \(ij\) incident to the \(i\)th vertex.

The newton’s descent algorithm is as follows:

  1. First, build the cotan-Laplace matrix L based on the above definitions
  2. Determine the descent direction \(\dot{u} \in \mathbb{R}^{|V_{\text{int}}|}\), by solving the system \(L \dot{u} = – \Omega\) with \(\Omega \in \mathbb{R}^{|V_{\text{int}}|}\).as the vector containing all of the angle defects at interior vertices.
  3. Run line search again, but with \(\dot{u}\) replacing \(– \Omega\) as the search direction.

This method yielded a completely flat mesh with no cracks. Newton’s method was also significantly faster: on one of our machines, Newton’s method took 3 ms to compute a crack-free parameterization for the cat head model while the original Yamabe flow implementation took 58 ms.

Categories
SGI research projects

Branch-and-bound method for calculating Hausdorff distance

This week I worked on the “Robust computation of the Hausdorff distance between triangle meshes” project with our mentor Dr. Leonardo Sacht, TA Erik Amezquita and my team Talant Talipov and Bryce Van Ross.

We started our project by doing some initial reading about the topic. Hausdorff distance from triangle meshes A to B is defined as $$h(A,B) = \max_{p \in A}d(p,B)$$ where d is the Euclidean norm. Finding the Hausdorff distance between two triangle meshes is one way of comparing these meshes. We note that the Hausdorff distance from A to B might be different from the Hausdorff distance from B to A, as you can see in the figure below, so it is important to distinguish which one is being computed.

Figure 1: Hausdorff distance from Mesh A to Mesh B
Figure 2: Hausdorff distance from Mesh B to Mesh A

Finally we define $$H(a,b) = \max{h(A,B), h(B,A)}$$ and use this value that is symmetric when comparing triangle meshes A and B.

Our first task was to implement Branch and Bound methods for calculating this distance. Suppose we want to calculate the Hausdorff distance from mesh A to mesh B. There were three main steps in the algorithm to do this: calculation of the upper and lower bound for the Hausdorff distance, and discarding and subdividing triangles according to the values of the upper and lower bound. 

The upper bound for each triangle in A is calculated by taking the maximum of the distances from the given triangle to every vertex in B.  The lower bound is calculated over A by taking the minimum of the distances from each vertex p in A to the triangle in B that is closest to p. If a triangle in A has an upper bound that is less than the lower bound, the triangle is discarded. After the discarding process, the remaining triangles are subdivided into four triangles and the process is repeated with recalculation of the upper bounds and the lower bound. The algorithm is run until the values for the upper and lower bound are within some ε of each other. Ultimately, we get a triangle region that contains the point that realizes the Hausdorff distance from A to B.

To implement this method, my teammates tackled the upper and lower bound codes while I wrote an algorithm for the discarding and subdividing process:

We ran this algorithm with testing values u = [1;2;3;4;5] and l = 3 and got these results:

Figure 3: Initial mesh
Figure 4: After discarding and subdividing

As expected, the two triangles that had the upper bound of 1 and 2 were discarded and the rest were subdivided.

 The lower bound algorithm turned out to be more challenging than we anticipated, and we worked together to come up with a robust method. Currently, we are working on finishing up this part of the code, so that we can run and test the whole algorithm. After this, we are looking forward to extending this project in different directions, whether it is a more theoretical analysis of the topic or working on improving our algorithm!

Categories
Talks

Week 5 Talks Summary

Authors: Bryce Van Ross, Deniz Ozbay, Talant Talipov

The following is a summary of three Week 5 talks, presented on behalf of students in the MIT Summer Geometry Institute. These summaries were made by members of the team of the Hausdorff Distance group. Topics include: Partitioned Solid-Fluid Coupling, Graduate School Panel and Q&A, and Developments in Smooth Optimization Contact.

Partitioned Solid-Fluid Coupling

This talk was presented by Dr. Tamar Shinar at University of California, Riverside. I liked this talk for several reasons. From an introductory physics background, we are aware that forces act on multiple objects. Depending on the type of object, certain forces behave differently with respect to the object and we use certain equations to model this interaction. However, as the system of objects becomes mixed, our use of forces becomes more complex. So, the modeling efforts must adapt accordingly. This lecture focused on how to model fluid-structure interaction (FSI), commonly referred to as solid-fluid coupling, via numerical algorithms, and discussed related applications. Examples of applications typically include fluid dynamics or animation. As suggested by Dr. Shinar, more intuitive, concrete examples are modeling the flight of a bird in the air (Figure 1), or the movement of a straight hair flip relative to a medium of water (Figure 2).

Figure 1: A bird (solid) flying in the air (fluid) adjacent to water droplets (another fluid). Image from unsplash.com/
Figure 2: A woman (solid) flipping her hair in a pool of water (fluid). Image from unsplash.com/

Solid-fluid coupling models the dynamics of fluids and solids. Specifically, these dynamics are computed simultaneously, which can be problematic. The challenge in this field is to make it less so, while ensuring a reflective representation of the physical forces at work. In 1- way coupling, the solid (or fluid) affects the fluid (solid), but not vice versa. This is not the case for 2-way coupling, where both objects affect each other, imposing more constraints upon the system. To account for each object’s phenomena, there exists solid and fluid handlers to model these phenomena, respectively. These solvers utilize a variety of boundary conditions, familiar to us from past math/physics courses, such as the Dirichlet, Navier-Stokes, and Neumann equations. Depending on the object and conditions, desirable properties are optimized. For solids, these would be mass and acceleration, whereas for fluids, these are position and velocity. The solution lies in the mixed-solver, and which numerical methods best model these behaviors.

There are multiple options to go about optimizing coupled-interaction. Partitioning the solver is a popular approach. In this approach, fixed point iteration and Newton’s method are strategies that solve the nonlinear system of equations, linearizing the 2-way coupling in terms of the solid and fluid. The partitioned methods tend to be more modular and easier to implement. In contrast, monolithic methods are more stable, have better performance, and handle closed regions better. In comparison to each other, their strengths are the other’s weaknesses. Common risks are that iterations can be computationally expensive and/or that they won’t converge at all. This is remedied by incorporating a reduced model interface (RMI), which serves as an intermediary lightweight solver between the solid and fluid. In effect, the RMI helps estimate tricky Jacobians in a least-weight sense. Dr. Shinar’s research specifically compares these numerical schemes in reference to an under-relaxation variable, which optimizes solution oscillations and aids in stability. The smaller this value, the slower and less efficient the computational time, in tradeoff for increased stability. The takeaways here are that the partition approach in isolation fails in terms of convergence, and the Partition-Coupling and RMI under low under-relaxation will yield optimal convergence in the shortest time. There still remain certain bounded regions, like (incompressible) Dirichlet regions, which interfere with the dynamics of known solid-fluid coupling techniques, but this has yet to be explored. For more information regarding Dr. Shinar’s research, please refer here.

An extended partitioned method for conservative solid-fluid coupling (Video from YouTube)

Developments in Smooth Optimization Contact

Professor Chenfanfu Jiang’s talk on “Developments in Smooth Optimization Contact” was really interesting for many reasons. Essentially the problem they were trying to solve was “How to model contact as a smooth problem”. This helps us accurately simulate solids which allows us to create realistic animations and benefits industry fields that use these simulations. For example in the fashion industry, these simulations provide feedback to the design of the garment.

Firstly, Dr. Jiang presented different ways to approach the problem and the advantages and shortcomings of these approaches. Then, he gave a formulation of how they came up with a solution using these, which was really interesting as it combined various approaches to come up with a better working algorithm. The research problem was also simple to understand but the tools used to solve the problem were very advanced, which was also very intriguing. 

To solve this problem three main tools were used: nonlinear optimization based integrator which simulated large deformation with large steps, variational frictional contact and its extension to higher dimensions. To start with, the solution is an optimization based time integrator for electrodynamics. It is based on incremented time steps, which creates an entirely new problem at each time step. The ODE consists of an inertia term and elasticity term – which makes the problem harder as the elasticity term can be highly nonlinear and non convex. This simulates deformations based on squashing and stretching. For a more physically accurate solution, contact is added as a constraint. This constraint in the form of an inequality, makes the differential equation even harder to solve. To overcome this challenge, different approaches were developed based on previous ways to solve the problem.

The difficulty arises from the fact that the formulated constraints and ODEs that are non-smooth and non-linear, for example, when the distance between objects is zero, we have a non-smooth constraint. To overcome this, the problem is turned into a smooth and unconstrained problem by using the incremental potential contact method which guarantees intersection and parameter tuning free simulations which are stable and accurate, and the barrier method, which turns the problem into an unconstrained problem where Newton iteration can be applied.

Dr. Jiang also discussed some methods that can improve their algorithm such as clamping the barrier function, and the shortcomings such as the difficulty of implementing friction in the optimization problem. Again, the challenges arise from the function becoming non-smooth, which he mentioned can be solved by approximately defining the variational friction as a smooth function.

The most intriguing part of the talk was how they were able to build on existing approaches to turn the problem into a smooth one. Although the techniques they used were very advanced, the idea behind the solution was simple to understand. The simulations (especially the twisting of the cloth) Dr. Jiang showed were also really interesting; it was fascinating to see the difference between two simulations of the same object and how they become visibly more accurate as the constraints change.

Figure 3: Twisting of a cloth (image from https://ipc-sim.github.io/file/IPC-paper-350ppi.pdf)
Figure 4: Rod twist (image from https://ipc-sim.github.io/file/IPC-paper-350ppi.pdf)

Graduate School Panel

Last week I attended a talk about applications to PhD programs that was organized by Leticia Mattos Da Silva, Silvia Sellán, Jiayi Eris Zhang and Oded Stein.

One of the most exciting deals for every student is application for graduate programs. Most students are always confused with this procedure: they do not know what to write in a motivation letter and how to contact the prospective referee. All these questions were answered in this lecture. This lecture was filled with a lot of useful information about all the steps of applications to universities: from motivation letters to the choice of prospective scientific advisor. It was really interesting on the grounds that the lecturers experienced this procedure firsthand. Moreover, the speakers showed their own essays as successful examples.

As I know from this talk, the motivation letter has a specific structure. The applicant has to mention his previous research experience, why he wants to study exactly on this program, and why the university has to choose this person among the others. Furthermore, there should not be any information that is not relevant to the program: if you are applying to a PhD program in Mathematics, then you do not have to say about your background in knitting. The best moments were when the lecturer highlighted the most frequent mistakes of applicants and I realized that I did it in my motivation letter.

The recommendation letters are one of the most significant parts of the application. That is why the applicant should connect with his referee in advance. The best choice would be the person who did some research with you. In addition, you should have more referees in the case that the main ones reject.

It was a very valuable experience to listen to this lecture!