Categories
Research

3D Object Reconstruction using 2D Medial Axis

During Week 3, we had the incredible opportunity to dive into an amazing project on 3D object reconstruction using medial axis. This journey wouldn’t have been possible without the guidance of Professor Kathryn Leonard and Professor Geraldine Morin. They were truly wonderful advisors, offering us their insight and support every step of the way. We’re so excited to share our thoughts and results with you all! Let’s start with some basic background.

by Stephanie Jung, Evelyn Zhu and Anja Milutinović
  • What is a Medial axis ?

The medial axis is the “skeleton” of a shape. In 2D, the medial axis of a shape is the set of all points that are equidistant from at least two points on the boundary, i.e. the centers of the largest circles you can inscribe inside it. Paired with the radius at each point, it’s a compact yet near-complete description of a shape: sweeping those inscribed disks/balls back along the axis reproduces the original subject. For a straight rod, the medial axis is a line, for a bent tube it’s a curve, and for a torus it’s a circle. The axis really captures a shape’s essential structure in far fewer numbers than the full surface. 

One of the nice properties of the medial axis is that it preserves topology and geometry of the original shape. Given the medial axis of a 2D shape and the corresponding radius of each medial axis point, the original shape can be reconstructed.

  • How do we Compute Medial axis using Voronoi diagrams?

The medal axis is defined with respect to the continuous boundary of a shape and computing exact medial axis is then difficult. It’s then easier to approximate it using Voronoi diagrams of sample points on the boundary.

If we have a set of sample points P = {p1, p2, … , pn}, the Voronoi cell of the sample point pi is a set of all points that are closer to pi, then any other pj:

Vi={x∈ℝn|‖x−pi‖≤‖x−pj‖, ∀j}V_i = \left\{ x \in \mathbb{R}^n \;\middle|\; \|x – p_i\| \le \|x – p_j\|,\ \forall j \right\}

The Voronoi diagram is a collection of all Voronoi cells.

The medial axis and Voronoi diagram’s edges both have in common that they are defined by points that are equidistant from multiple boundary locations. The algorithm to compute medal axis then becomes:

  1. Sample the boundary of the given object
  2. Construct the Voronoi diagram of the sample points
  3. Keep only the Voronoi vertices that are inside the object
  4. Connect the neighboring vertices with existing Voronoi edges
A visual example showing the medial axis of a 2D Baymax silhouette. This particular image actually shows a faulty medial axis. Based on the definition of medial axis, you can determine visually which branches should not be there.

With this foundational understanding of medial axes and Voronoi diagrams under our belts, we were ready to tackle the core of our Week 3 project. We wanted to see if we could take these 2D ‘skeletons’ and use them to solve a much more complex problem: bringing flat images to life by reconstructing a full 3D object from them.

Reconstructing 3d object from its 2d images using medial axis

Method 1:

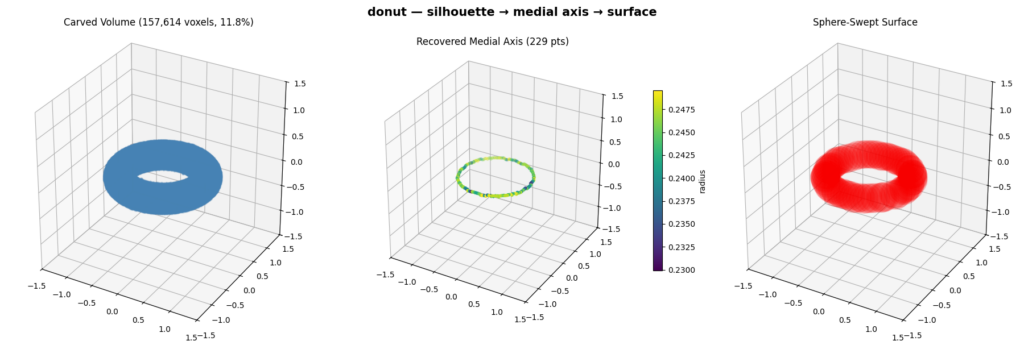
  • We reconstruct a 3D object from a set of binary silhouettes taken from viewpoints spread over a sphere. For each view we compute an orthographic projection of the mesh to get a silhouette, then extract its 2D medial axis and radius via the Voronoi diagram of the boundary. We then fuse the views in 3D by carving a voxel grid (keeping only voxels whose projection lands inside every silhouette) and thin the result with a 3D skeletonization to recover the object’s 3D medial axis. Finally, we rebuild the surface by sweeping balls of the recovered radius along that axis, which reproduces the original shape. 

Pipeline Visualization:

Method 2:

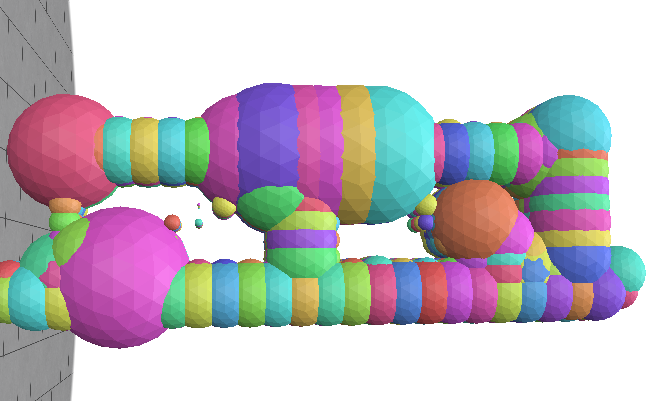
  • Each point on a 2D medial axis represents the center of a maximal inscribed circle. All of the possible centers lie along the camera’s viewing direction. So then, every circle naturally defines a cylinder in 3D space whose axis is the same direction as the camera viewing direction and whose radius equals the radius of the medial circle. Each orthographic image generates an entire set of cylinders, or as we called them “swept cylinders”.
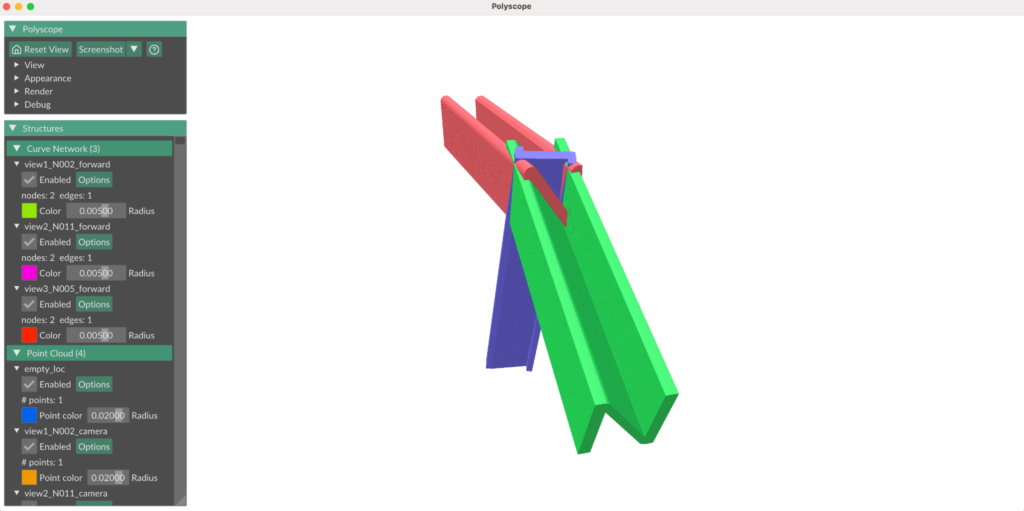
  • We position the “swept cylinders” by setting the medial axis from each camera view in a world space and using the camera parameters (orthographic scale, location with respect to the object, viewing direction) to position each 2D medial axis about the world origin such that it reflected the camera view about the original 3D object. 
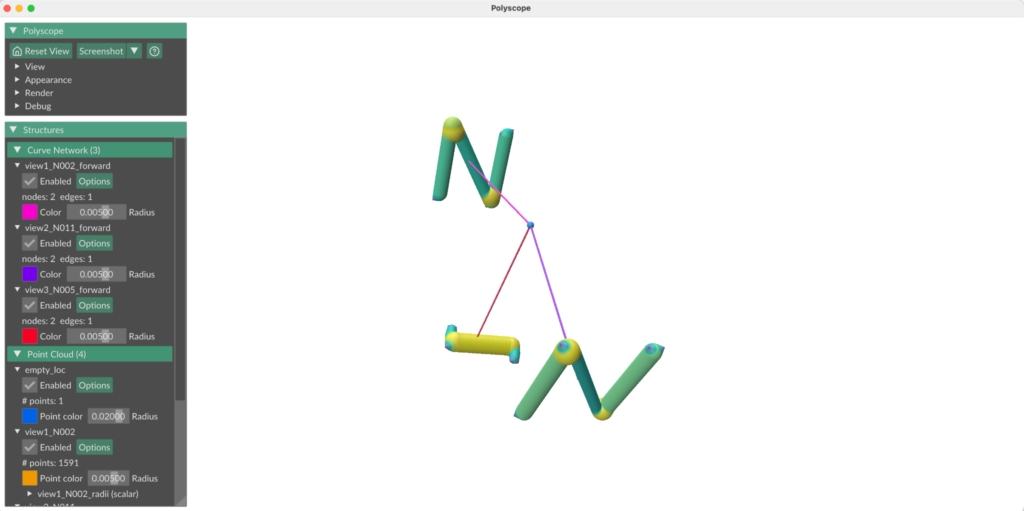
N model: Medial axes from 3 different camera views, projected into a world space. Line propagating from the center of each camera view indicates camera forward direction. Blue point (where all camera forwards intersect) indicates the point all cameras were focused on (center of the original 3D object).
N model: Visualization of swept cylinders.

Intersecting the “sweep cylinders” from multiple views in 3D space, gives us a feasible reconstruction region:

Ω=⋂swept cylinders(⋃cylinders in swept cylinderC)\Omega = \bigcap_{\text{swept cylinders}} \left( \bigcup_{\text{cylinders in swept cylinder}} C \right)

Method 2a:

To compute the radii of each sphere we use a signed distance function for a cylinder. Since the center point can belong to multiple cylinders, in each “swept cylinder”, we take the one where the point has a maximum SDF. The sphere must be contained in the intersection of each chosen “swept cylinder”, so the final radius is taken as minimum.

R(p)=minswept cylinders⁡(maxcylinders in swept cylinder⁡SDF⁡(c,p))R(p)=\min_{\text{swept cylinders}} \left( \max_{\text{cylinders in swept cylinder}} \operatorname{SDF}(c,p) \right)
One of the view of the object with it’s 2d medial axis
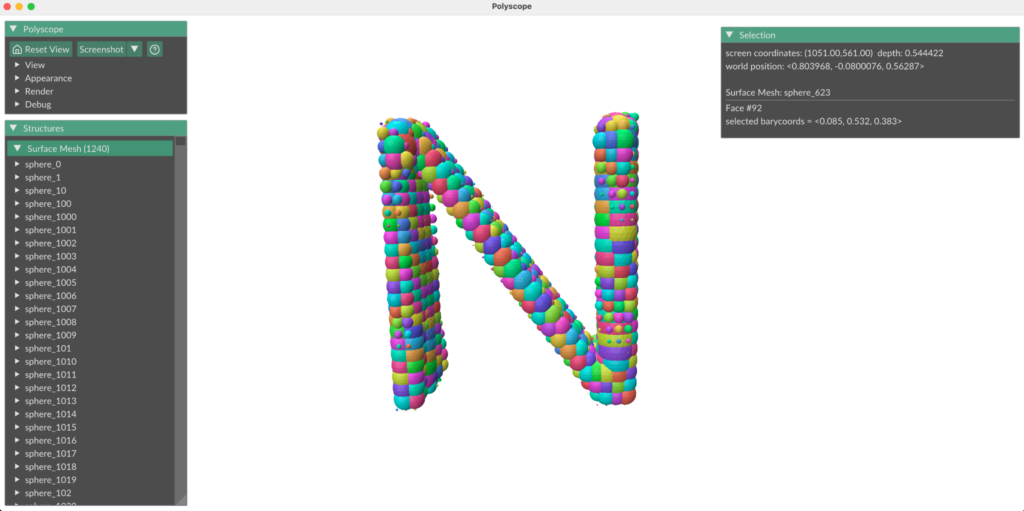
Reconstruction using maximal spheres with sampled sphere centers

Method 2b:

In an alternative method, to compute the radii of each sphere we use the signed distance field of the binary image for each view, which evaluates a point’s distance from the nearest boundary of the shape. We sample points in 3D space at regular intervals and project them down into each view’s 2D image plane, then compute the signed distance for the point in that view. This method is functionally equivalent to using a 3D signed distance field in world space; it evaluates a point’s distance from the nearest boundary of the swept cylinder for that camera view. Then, the radius of a sphere centered at a point is the minimum signed distance across all camera views, since the sphere must be contained in the intersection of all swept cylinders.

N model (3D)
N model: binary image of the N model from one camera view
N model: Reconstruction of N model, from images taken from 3 different camera views

Categories
Research

Surface Log Maps

by Anja Milutinovic and Shannon Cudworth

Geodesics and geodesic distance

Suppose we have a curved surface M⊂ℝ3\mathbb{R}^3. If we want to measure distances or move from one point to another, Euclidean straight lines are no longer appropriate because they leave the surface. So we generalise the notion of a “straight line”, by seeking the straightest possible path that remains on the surface. This is called a geodesic.

More formally, a geodesic is a curve that locally minimizes the length L of the curve:

L(γ)=∫01‖γ′(t)‖dt,where γ′(t)∈Tγ(t)M.L(\gamma)=\int_0^1 \|\gamma'(t)\|\,dt,\quad \text{where }\gamma'(t)\in T_{\gamma(t)}M.

The geodesic distance between two points p, q M is:

dM(p,q)=infγ:[0,1]→M,γ(0)=p,γ(1)=q⁡L(γ)d_M(p,q)=\inf_{\gamma:[0,1]\to M,\,\gamma(0)=p,\,\gamma(1)=q}L(\gamma)

Exponential and logarithmics maps

Given a point p∈Mp\in M and a tangent vector v∈TpMv\in T_pM, there exists a unique geodesic γ\gamma such that γ(0)=p\gamma(0)=p and γ′(0)=v\gamma'(0)=v. Exponential map Expp⁡:TpM→M\operatorname{Exp}_p:T_pM\rightarrow M is a map that for every v∈TpMv\in T_pM gives the endpoint of the geodesic starting at p with the direction vv and length ‖v‖\|v\|. 

Then, the logarithmic map is the inverse of the exponential map,  Logp⁡:M→TpM\operatorname{Log}_p:M\rightarrow T_pM, whenever the exponential map is invertible. Logarithmic map for any given point q∈Mq\in M is a tangent vector that gives the initial direction of a geodesic starting at p and ending at q.

Combining the logarithmic map with the frame ϕp:TpM→ℝ2\phi_p:T_pM\rightarrow\mathbb{R}^2, we get 

z=ϕp∘Logp⁡z=\phi_p\circ\operatorname{Log}_p, that maps any point q on a surface into ℝ2\mathbb{R}^2.

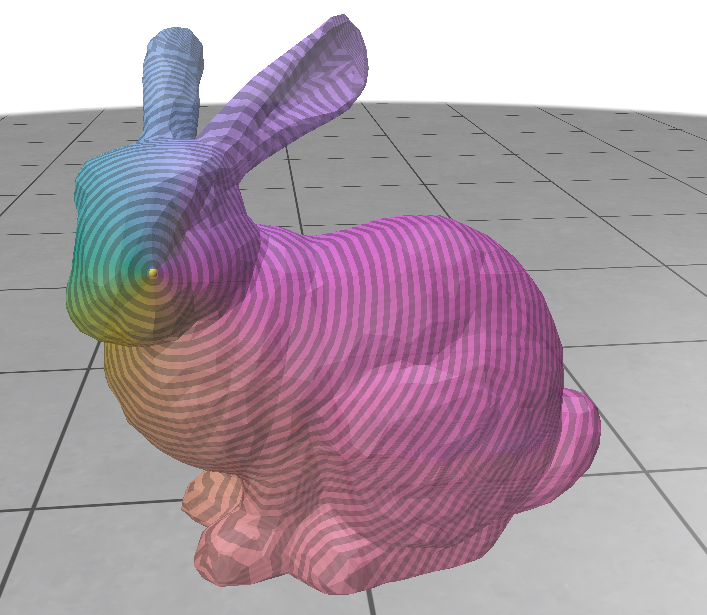
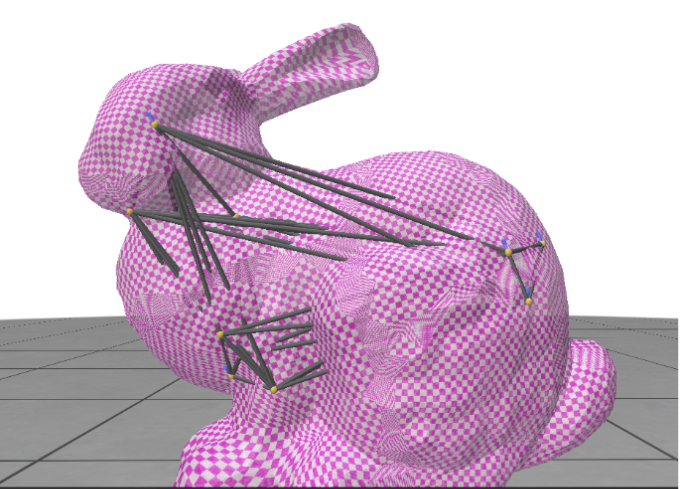
Local parameterization of the Stanford Bunny using a logarithmic map centered at a selected point.

Levi Civita connections

Given two neighboring vertices v1,v2v_1, v_2 on a discrete triangle mesh, we can define corresponding tangent vectors t1,t2,t_1, t_2, such that t1t_1and t2t_2 belong to the tangent planes at v1v_1 and v2,v_2,respectively. Since t1, t2t_1,\ t_2 lie on different tangent planes, we cannot meaningfully compare them. Our goal is to define a parallel transport, which moves one tangent vector to another tangent plane at an adjacent vertex, while minimizing rotation, known as the Levi Civita connection.

To implement the Levi Civita connection, we are given a dictionary containing all vertices with a shared edge, and the normal vector defined at every vertex viv_i. By looping over all shared edges i,ji,j, we take neighboring vertices vi,vjv_i, v_j and we index and define the normal vectors corresponding with the vertices, labeled n1n_1 and n2n_2, respectively.  We then use the normals to calculate the Rodrigues Rotation, or the rotation of a vector by a specific angle around a fixed axis. The formula to determine this rotation matrix is given by:

R=I+vx+vx2×1−cs2R = I + v_x + v_x^2 \times \frac{1-c}{s^2}

where v=n1×n2, c=n1⋅n2, s=||v||, 𝐯×=[0−v2v1v20−v0−v1v00]v = n1 \times n2,\ c = n1 \cdot n2, \ s = ||v||, \ \mathbf{v}_{\times}=\left[\begin{array}{ccc}0&-v_2&v_1\\v_2&0&-v_0\\-v_1&v_0&0\end{array}\right]

Then R approximates Levi Civita connection between adjacent tangent planes.

Connection Laplacian

After constructing the Levi Civita connection, we want to compare the tangent vectors at neighboring vertices, which is accomplished through the Connection Laplacian. As before, we loop over all vertices i,j with shared edges, and first define the cotangent weights, which are given by:

wij=12(cotαij+cotβij)w_{ij} = \frac{1}{2}(cot\alpha_{ij} + cot\beta_{ij})

where αij\alpha_{ij} and βij\beta_{ij} are the two angles opposite the edge (i, j). Now we can define the Connection Laplacian matrix, defined as:

Lij={(∑k∈N(i)wik)I,amp;i=j,−wijRji,amp;(i,j) is an edge,0,amp;otherwise. L_{ij}= \begin{cases} \left(\displaystyle\sum_{k\in N(i)} w_{ik}\right)I, & i=j, \\[1.2ex] -w_{ij}R_{ji}, & (i,j)\text{ is an edge}, \\[0.8ex] 0, & \text{otherwise}. \end{cases}

where wijw_{ij} is the cotangent weight between vertex i and vertex j, RijR_{ij} is the Levi Civita connection between vertex i and vertex j, and N(i)N(i) is the set of adjacent vertices to vertex i. Once the Connection Laplacian is defined, we can now measure how tangent vector fields change across vertices and our mesh.

Heat Diffusion & Vector Heat Method

With the Levi Civita connection and the Connection Laplacian, we can now define the Vector Heat Method (VHM), which approximates parallel transports between arbitrary vertices on our surface.

Given a mass matrix M, a connection laplacian L, an initial vector field V, and a small time step h, we can solve the vector heat equation:

(M+hL)X=V(M + hL)X = V

where X is a vector field that approximates the parallel transport of V along the minimal geodesics.

We now introduce a set of user-selected seed vertices S = { s1, ... ,sks_1,\ … \ , s_k } ⊂V. Via the VHM, we can approximate the parallel transport between any arbitrary seed vertices. Our goal is to extend this to the Affine Heat Method, which will use the VHM estimations of parallel transport between seed frames to optimize a set of tangent frames, allowing adjacent logarithmic maps to be more effectively blended.

Seed graph with optimal frames & UV offset

A single logarithmic map only provides a low-distortion parameterization around one point on the surface. To cover the entire mesh, we choose a small set of seed verticesS={s1,…,sk}⊆V,S=\{s_1,\ldots,s_k\}\subseteq V,and compute one logarithmic map around each seed. Each seed defines its own local coordinate system describing the nearby geometry.

Since these maps are computed independently, their coordinate systems are arbitrary. Even if two neighboring maps describe the same part of the surface, one may be rotated relative to the other. Before we try to combine the maps, their orientations must be made consistent.

We therefore associate each seed with a local frame ts∈TsMt_s \in T_sM. Specifically, we define a linear map Ψs:TsM→R2\Psi_s : T_sM \rightarrow \mathbb{R}^2 that maps the local frame to the horizontal axis of the plane.

However, the maps may still be translated.o fix this, we assign each seed a UV offset ws∈R2w_s\in\mathbb{R}^2. Neighboring logarithmic maps should predict the same relative displacement, leading to the consistency condition:

ws′≈ws+Ψs(logs⁡(s′)).w_{s’} \approx w_s + \Psi_s\!\left(\log_s(s’)\right).

he UV offsets are then computed by minimizing the disagreement between neighboring seeds.

Blending seed’s log maps

The final step was to combine the local parameterizations into a single global UV map. This involves deciding which local maps influence each part of the surface and how they should be combined. One way to this is to partition the surface into Voronoi cells, where each vertex is assigned to its nearest seed according to geodesic distance and inherits that seed’s local parameterization. While this approach is simple and efficient, it creates visible seams at the boundaries between neighboring cells.

Global UV parameterization of the Stanford Bunny using a Voronoi partition of local logarithmic maps.