Categories
Research

Intrinsic Mollification

FellowsHossam Saeed,  Ikaro Costa,  Ricardo Gloria,  Sana Arastehfar

Mentored ByKeenan Crane

VolunteerZachary Ferguson

1. Introduction

Algorithms on meshes often require some assumptions on the geometry and connectivity of the input. This can go from simple requirements like Manifoldness to more restrictive bounds like a threshold on minimum triangle angles. However, meshes in practice can have arbitrarily bad geometry. Hence, many strategies have been proposed to deal with bad meshes (see Section 2). Many of these are quite complicated, computationally expensive, or alter the input significantly. We focus on a simple, very fast strategy that improves robustness immediately for many applications, without changing connectivity or requiring sophisticated processing.
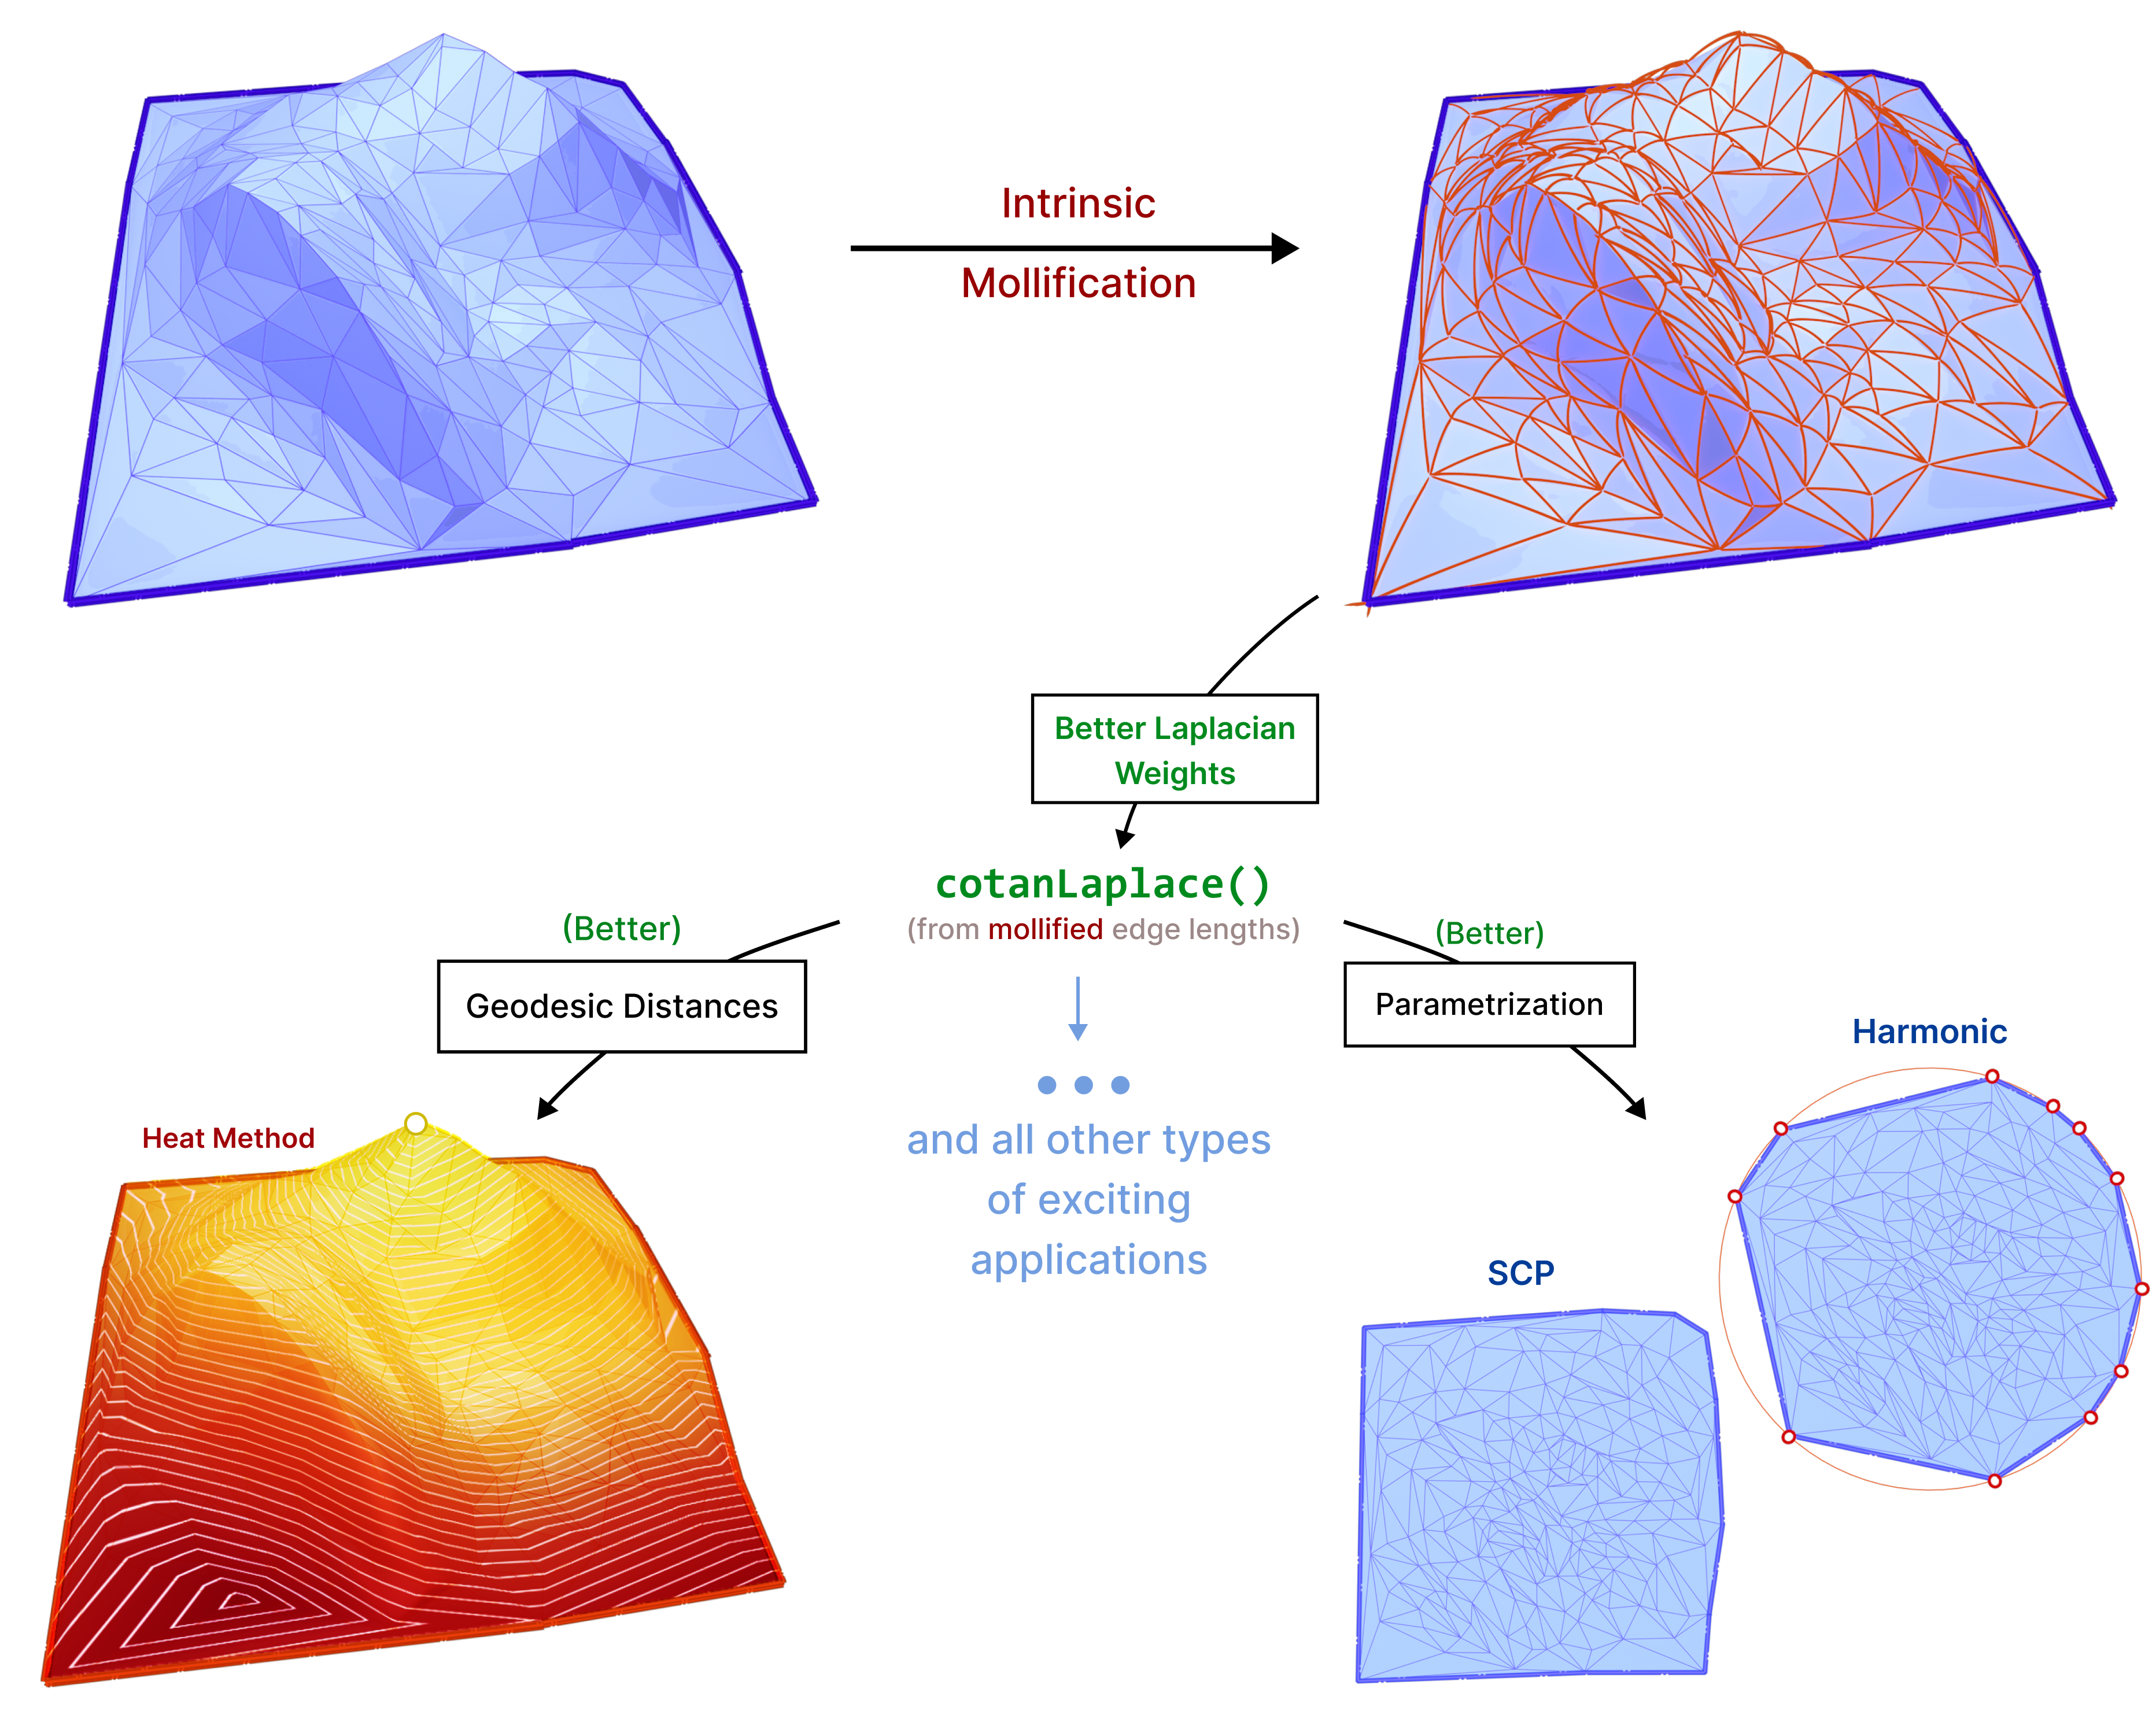
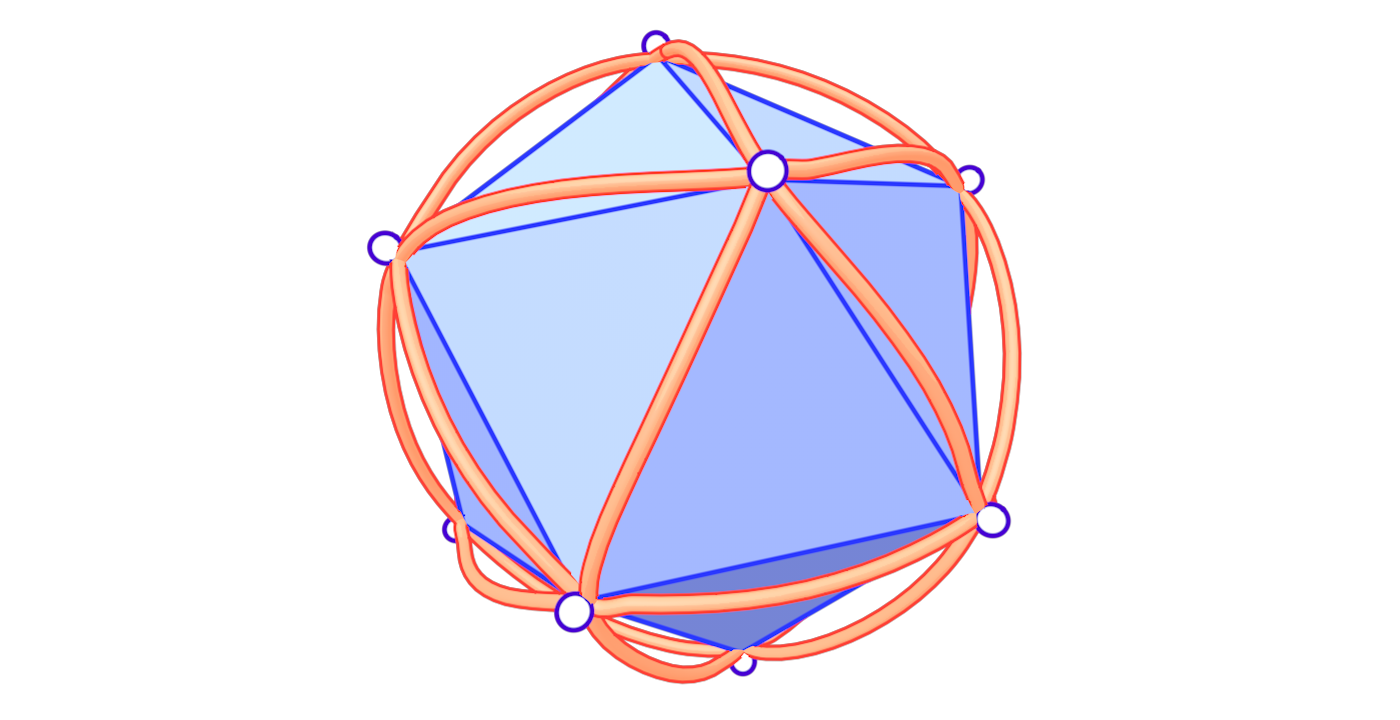
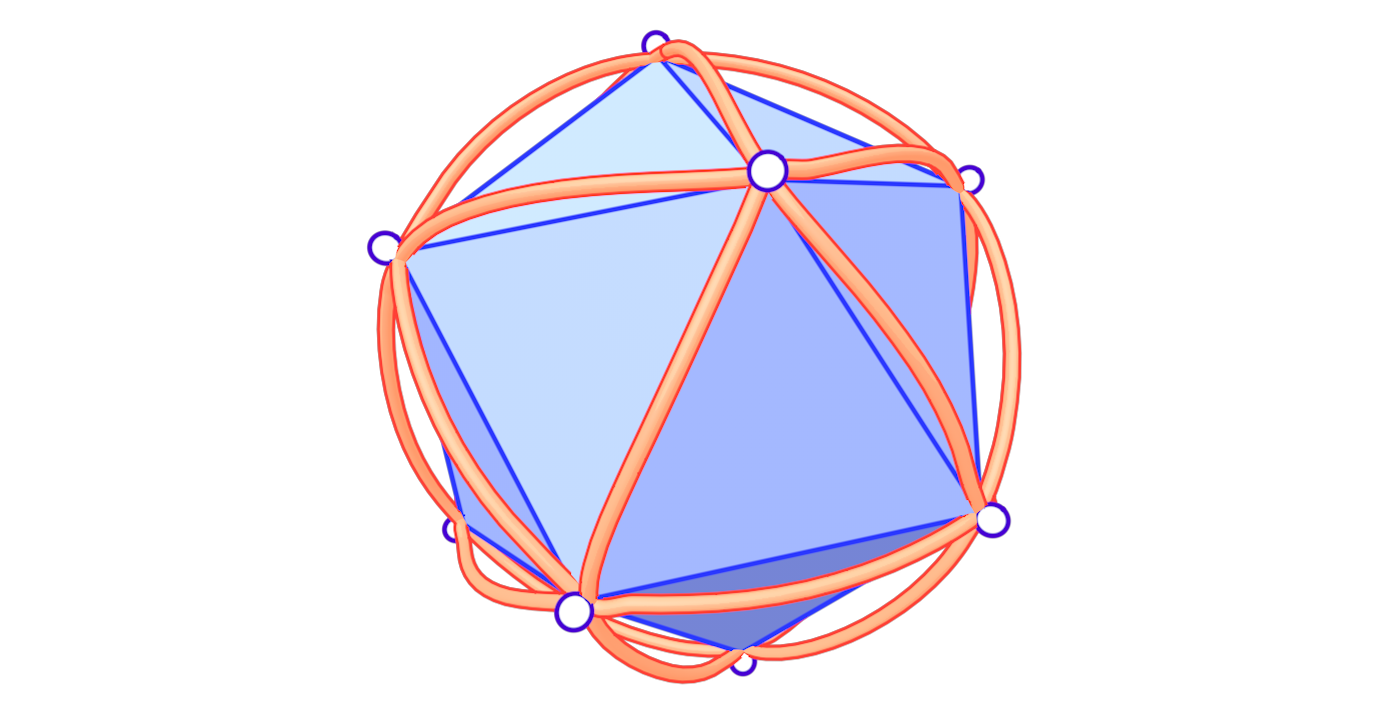
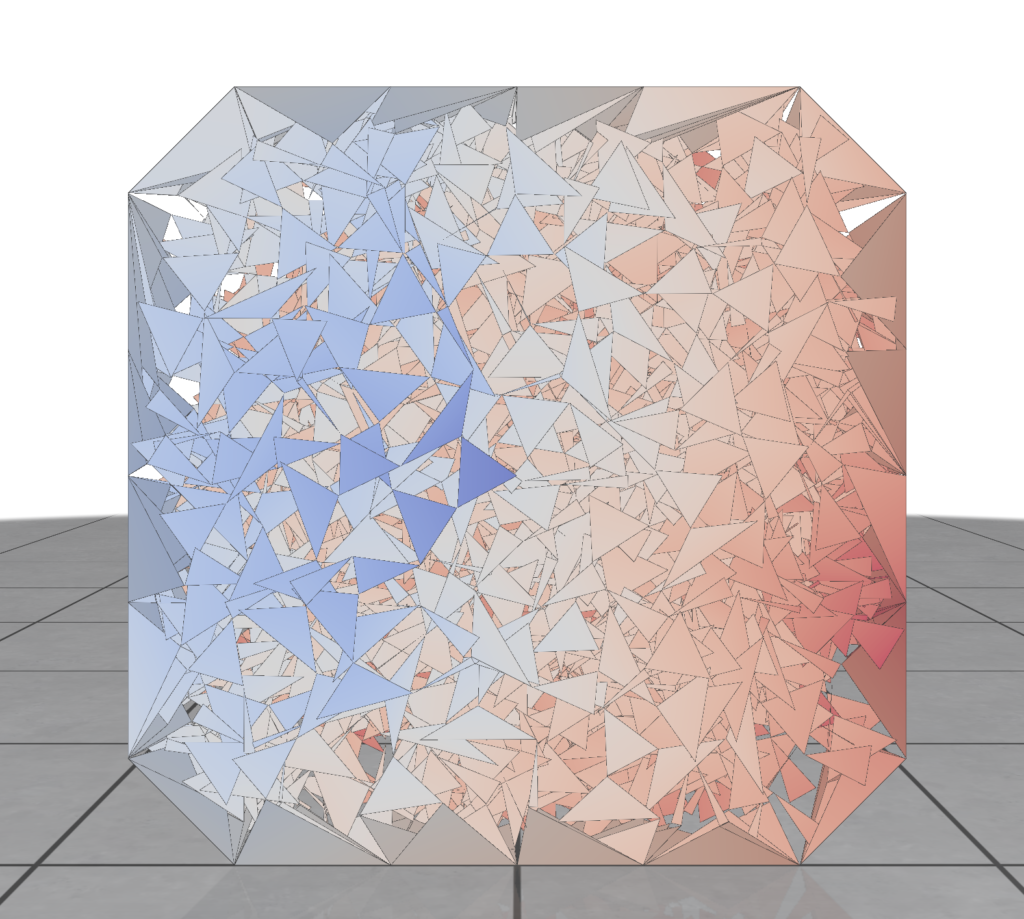
Fig. 1. By intrinsically modifying edge lengths, we can get better Cotan Laplace weights for skinny triangles in the input mesh, making algorithms using the Laplacian more robust and accurate.

The main idea is that we can compute geometric quantities (like the Laplacian Δ) from an intrinsic representation (using edge lengths), This makes it easy to manipulate these lengths without moving vertices around, to improve triangle quality, and subsequently these computations. We introduce new schemes based on the same concept and test them on common applications like parameterization and geodesic distance computation.

Throughout this project, we mainly used Python and Libigl as well as C++, Geometry Central and CGAL for some parts.

1.1 What can go wrong?

When using the traditional formula to compute The Discrete Laplacian, many issues can arise. There are important challenges with the mesh that can harm this computation:

  1. The mesh might not correctly encode the geometry of the shape.
  2. Floating point errors: Inaccuracy and NaN outputs.
  3. Mesh connectivity: non-manifold vertex and non-manifold edges.
  4. Low-quality elements: like skinny triangles.

It is worth mentioning that (3) is addressed successfully in “A Laplacian for Nonmanifold Triangle Meshes” [1]. Throughout this project, we get deep into the challenge (4). Such elements can originate from bad scans, bad triangulations of CAD models, or as a result of preprocessing algorithms like hole-filling. A thorough analysis of bad-quality elements can be found in “What Is a Good Linear Finite Element?” [2].

Usually, to compute the Discrete Laplacian for triangular meshes, one uses the cotangent value of angles of triangles in the mesh (see section 3.2). Recall that \(\cot\theta = \cos\theta / \sin\theta\). Therefore, an element having angles near 0 or 180 degrees will cause numerical issues as \(\sin(\theta)\) will be very small if \(\theta\) is near zero or near \(\pi\).

1.2 What is the basic approach?

The triangle inequality states that each edge length of the three is a positive number smaller than the sum of the other two. Low-quality elements, such as the ones in the figure above, barely satisfy one of the three required triangle inequalities. For instance, if a triangle has lengths \(a, b\) and \(c\) where the opposite angle of \(c\) is very close to \(\pi\), then \(a+b\) will be barely greater than \(c\).

In a nutshell, the simple approach is to make sure that each triangle of the mesh holds the triangle inequalities by a margin. This is, for each corner in the mesh we guarantee that \(a+b>c+\delta\) for a given \(\delta > 0\). To accomplish this in each corner, we add the smallest possible value \(\varepsilon>0\) to all edges in the mesh such that \(a+b>c+\delta\) is held for each corner.

1.3 Contributions

We introduce a variety of novel intrinsic mollification schemes, including local schemes that operate on each face independently and global schemes that formulate intrinsic mollification as a simple linear (or quadratic) programming problem.

We benchmark these approaches in comparison to the simple approach introduced in “A Laplacian for Nonmanifold Triangle Meshes” [1]. We run them as a preprocessing step on common algorithms that use the Cotan-Laplace matrix. This is to compare their effect in practice. Of course, this comparison also includes comparing the effects of no mollification, and simple hacks against these schemes, as well as the effects of different parameters. This is discussed in great detail in the Experiments & Evaluation section.

A large amount of work has been done on robust geometry processing and mesh repair. In particular, there have been a variety of approaches to dealing with skinny triangles. These include remeshing and refinement approaches, the development of intrinsic algorithms and formulations, and simple hacks used to avoid numerical errors.

Remeshing can significantly improve the quality of a mesh, but they are not always applicable. Naturally, they alter the underlying mesh considerably. Moreover, may not be able to preserve the original mesh topology. In addition, remeshing is often computationally expensive and may be overkill if the mesh is already of good quality except for a few bad triangles. On the other hand, Mesh refinement at least preserves the original vertices. However, it increases the number of elements significantly and is still expensive in many cases. A thorough discussion of Remeshing algorithms can be found in “Surface Remeshing: A Systematic Literature Review of Methods and Research Directions” [3].
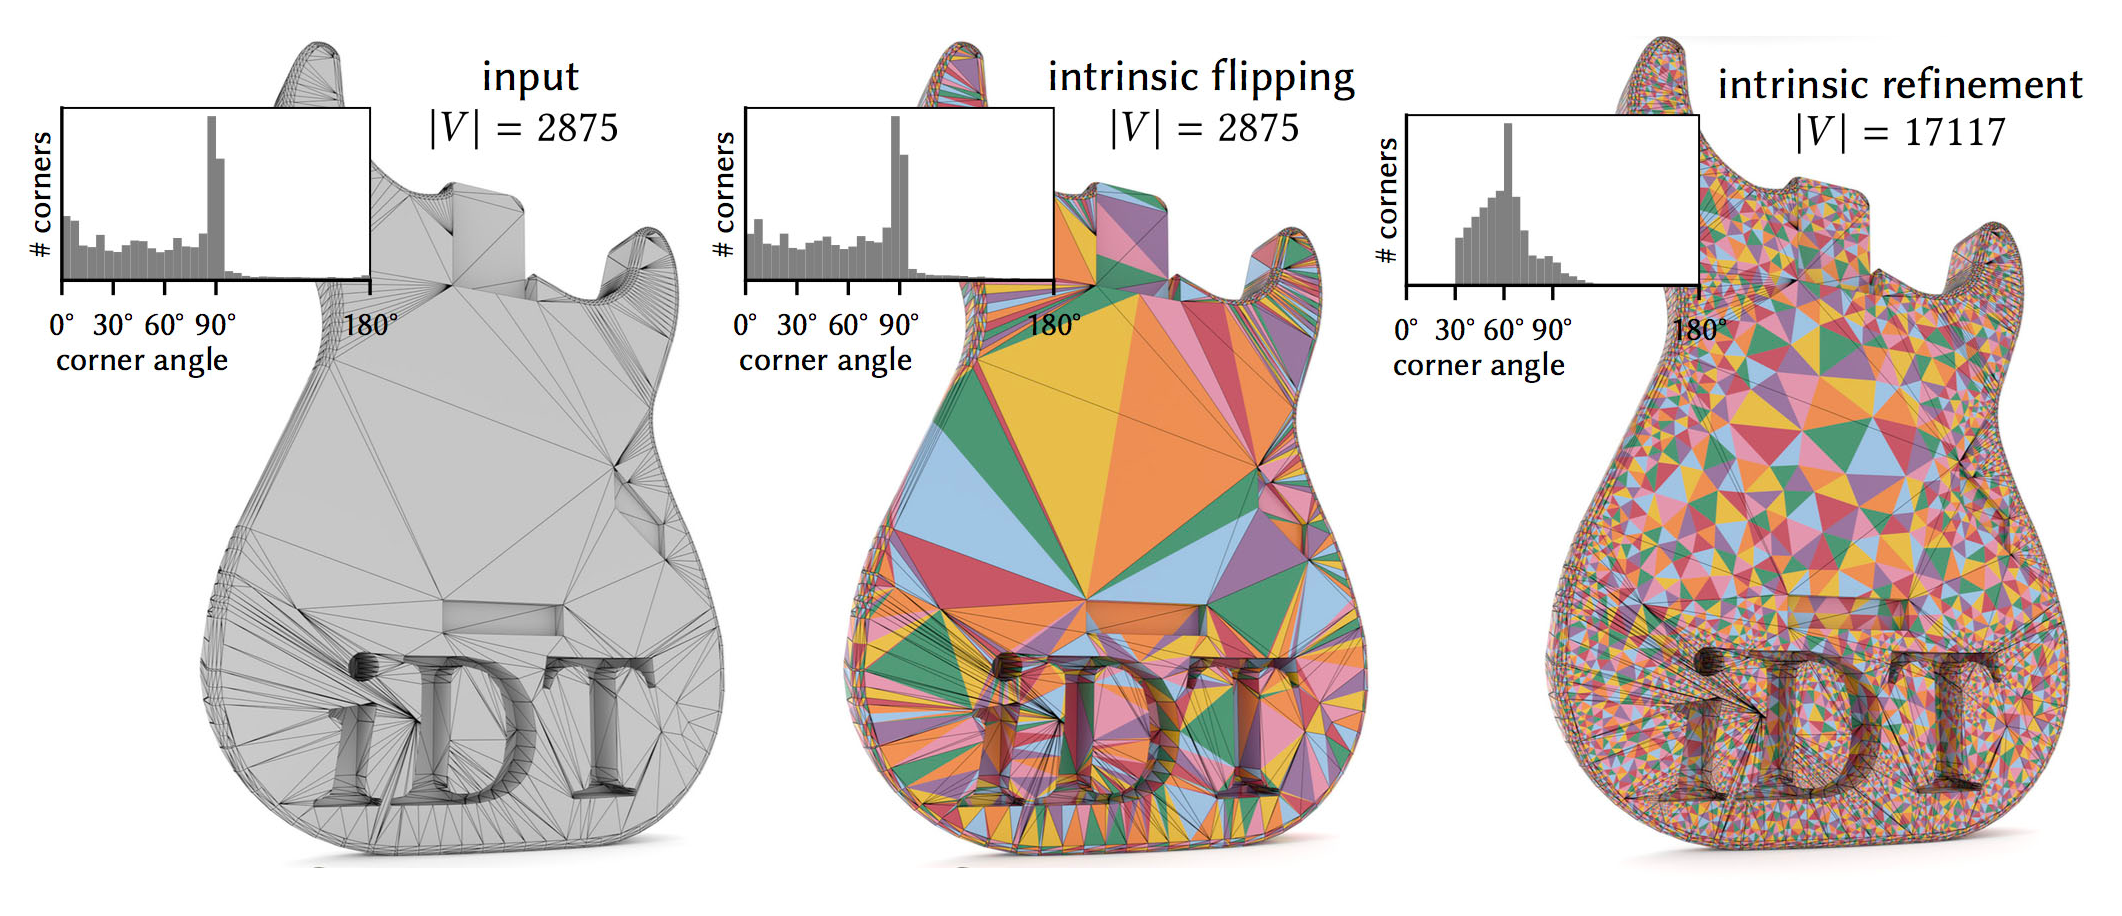
Fig. 3. (from [5]) Intrinsic Delaunay Triangulations (middle) fix some of the near-degenerate triangles (\(\theta \approx 0^o\)). Intrinsic Delaunay Refinement (right) provides bounds on minimum angles at the cost of introducing more vertices.

In contrast to extrinsic approaches that may damage some elements while trying to fix others, intrinsic approaches don’t need to move vertices around. For example, “Intrinsic Delaunay Triangulations” [4] using intrinsic flips can fix some cases of skinny triangles. However, it is not guaranteed to fix other cases. “Intrinsic Delaunay Refinement” [5] on the other hand provides bounds on minimum triangle angles at the cost of introducing more vertices to the intrinsic mesh. While these Intrinsic Delaunay schemes have many favorable properties compared to the traditional Remeshing and Refinement schemes, Intrinsic Mollification is much faster in case we only want to handle near-degenerate triangles. Moreover, it does not change the connectivity at all. For cases where an Intrinsic Delaunay Triangulation is required, we can still apply Intrinsic Mollification as a preprocessing step.

Lastly, Simple clamping hacks can sometimes improve the robustness of applications. But, they distort the geometry as they do not respect the shape of the elements corresponding to the clamped weights. Also, they seem to be less effective than mollification on the benchmarks we ran. They are discussed in detail in section 5.2.

3. Preliminaries

3.1 Intrinsic Triangulations

Our work is rooted in the concept of Intrinsic Triangulations. In practical Geometry Processing, triangular meshes are often represented by a list of vertex coordinates in addition to the connectivity information. However, we usually do not care about where a vertex is in space, but only about the shape of the triangles and how they are connected. So, working with vertex coordinates is not necessary and gives us information that can hinder robust computing.

Working with Intrinsic Triangulations, meshes are represented with edge lengths in addition to the usual connectivity information. In this way, we do not know where the object is, but we have all the information about the shape of the object. For a thorough introduction to Intrinsic Triangulations, see “Geometry Processing with Intrinsic Triangulations” [6] by Sharp et al.

3.2 Cotangent-Laplace Operator

Recall that the Laplace operator \(L\) acts on functions \(f:M\to\mathbb{R}\) where \(M\) is the set of vertices. For each vertex \(i\) the cotangent-Laplace operator is defined to be

\((\Delta f)i = \frac{1}{2A_i}\sum_j (\cot(\alpha_{ij}) + \cot(\beta_{ij})(f_j – f_i)\)

where the sum is over each \(j\) such that \(ij\) is an edge of the mesh, \(\alpha_{ij}\) and \(\beta_{ij}\) are the two opposite angles of edge \(ij\), and \(A_i\) is the vertex area of \(i\) (shaded on the side figure).
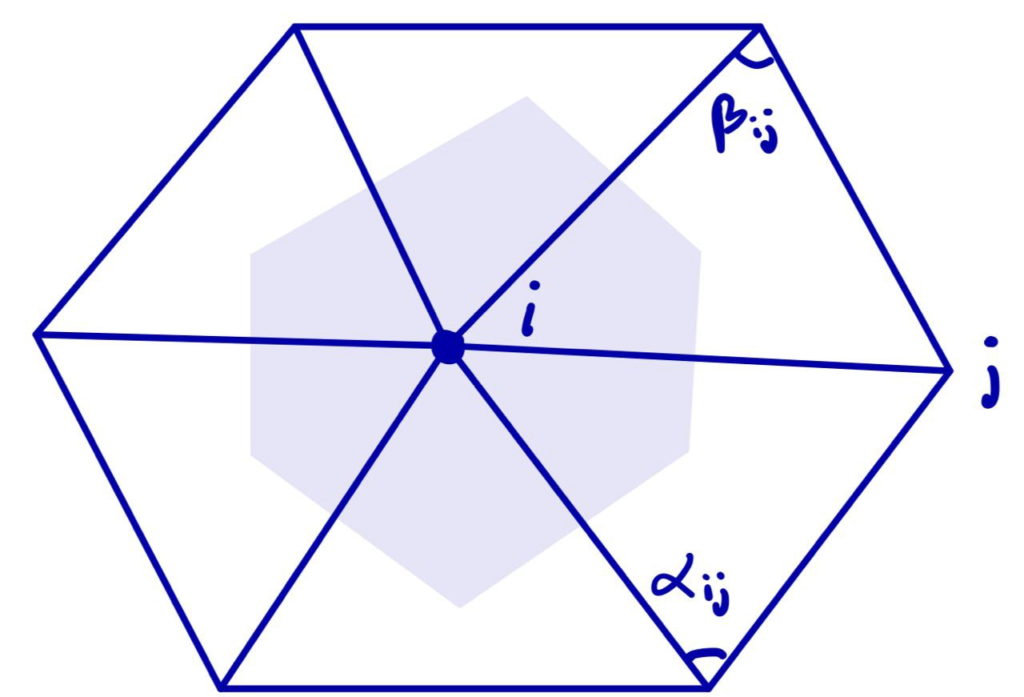
The discrete Laplacian Operator is encoded in a \(|V|\times |V|\) matrix \(L\) such that the \(i\)-th entry of vector \(Lf\) corresponds to \((\Delta f)_i\). The Discrete Laplacian is extremely common in Geometry Processing algorithms such as:

  • Shape Deformation.
  • Parameterization.
  • Shape Descriptors.
  • Interpolation weights.

4. Algorithm

Fig. 5. Intrinsic Mollification visualized on a mesh, The blue edges are the original (extrinsic) lengths, and the intrinsic (mollified) lengths are visualized as orange arcs that are longer while still having the same endpoints.

To solve the problem of low-quality triangles, we mollify each triangle in the mesh. By “mollify”, we mean pretending that the mesh has better edge lengths so that there are no (intrinsically) thin triangles in the mesh. Generally, for a mesh, equilateral triangles are the best to work with. If we add a positive \(\varepsilon\) value to each of the edges of a triangle, the resulting triangle will be slightly closer to an equilateral one. In fact, it will become more equilateral as \(\varepsilon\) approaches \(\infty\). However, we don’t want to distort the mesh too much. So, we find the smallest \(\varepsilon\geq 0\) such that by adding \(\varepsilon\) to each edge of the mesh we end up with no low-quality triangles. A good way to think about Intrinsic Mollification is to fix the position of each vertex of the mesh and let the edges grow to a desired length, as illustrated in Figure 5 above.

4.1 The Constant Mollification Strategy

We first recap the strategy proposed by Sharp and Crane [1]. If a triangle has lengths \(a, b\), and \(c\), the triangle inequality \(a + b < c\) holds even for very low-quality triangles. In order to avoid them, that triangle inequality must hold by a margin. This is, we ask that

\(a + b < c + \delta\)

for some tolerance \(\delta > 0\) defined by the user. Then the desired value of \(\varepsilon\) is

\(\varepsilon = \max_{ijk} \max(0, \delta + l_{jk} – l_{ij} – l_{ki} )\)

where each \(ijk\) represents the corner \(j\) of the triangle formed by vertices \(i, j, k\) and each \(l_{ij}\) represents the length of edge \(ij\).

Phase I of this project consisted of implementing this functionality. Given the original edge lengths \(L\) and a positive value \(\delta\). The function returns the computed \(\varepsilon\) and matrix \(newL\) with the updated edge lengths in the same form as \(L\).
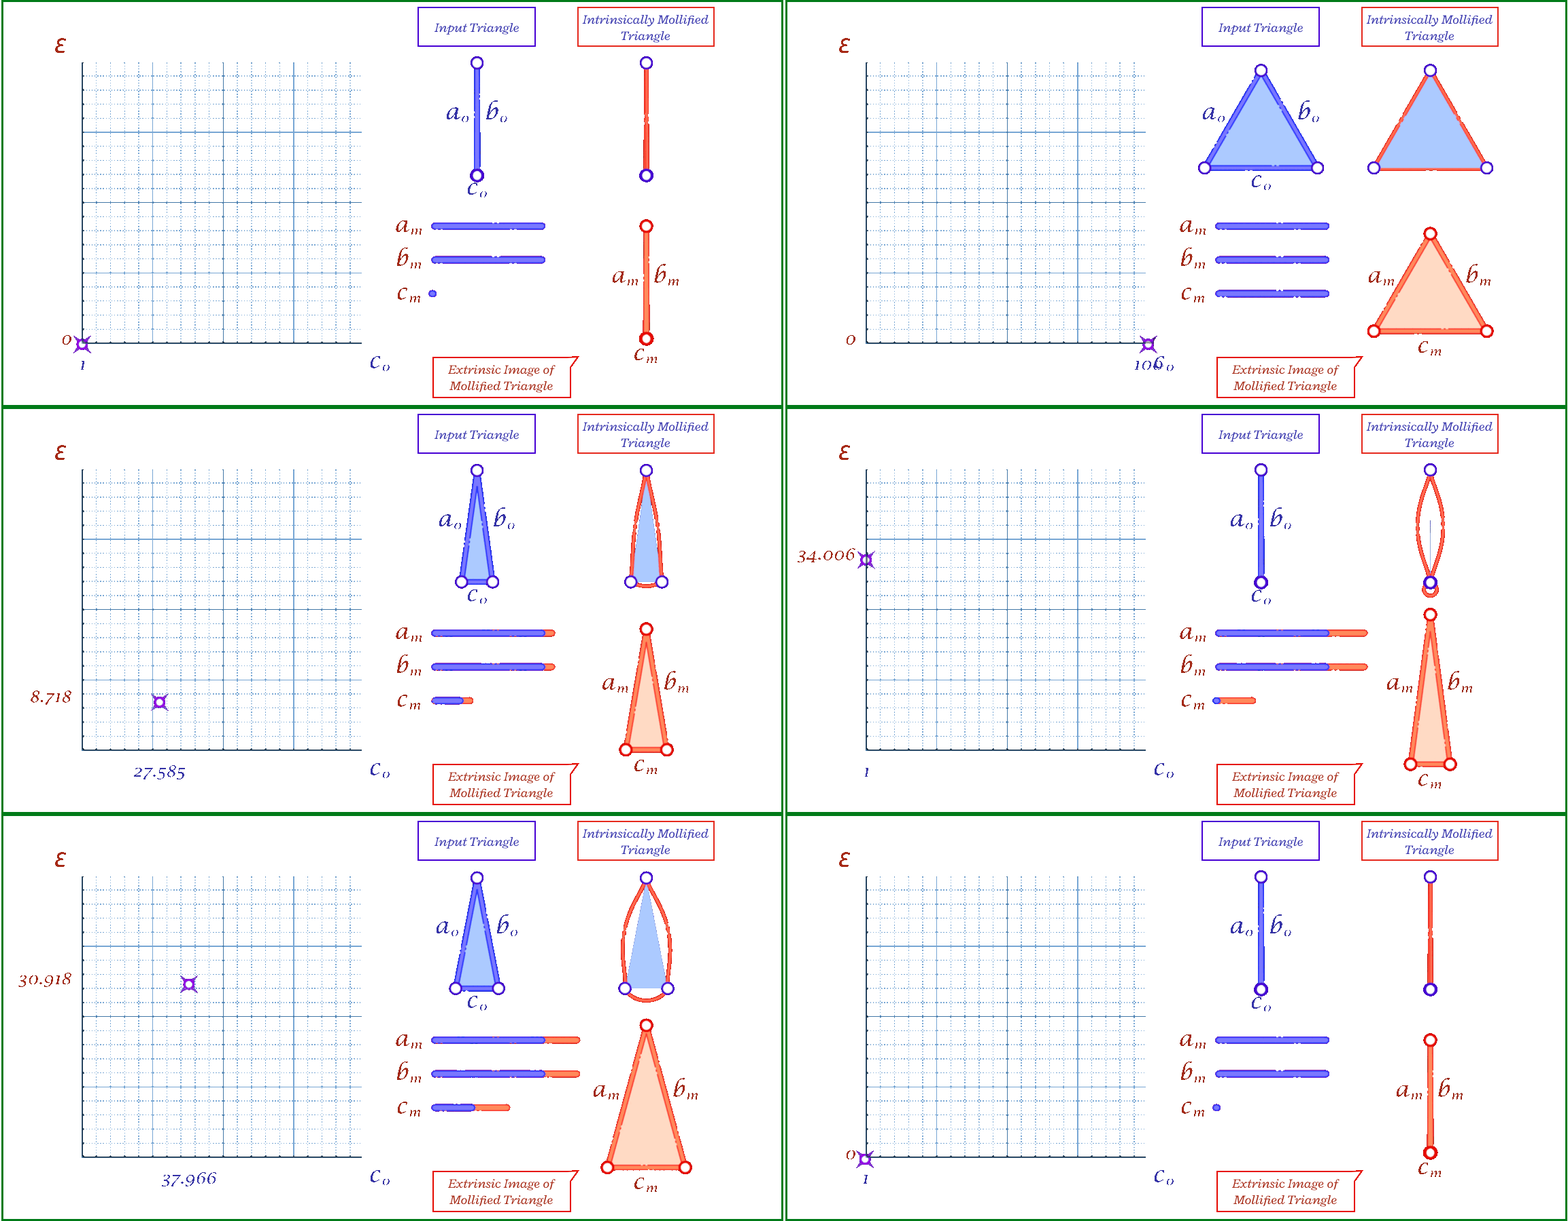
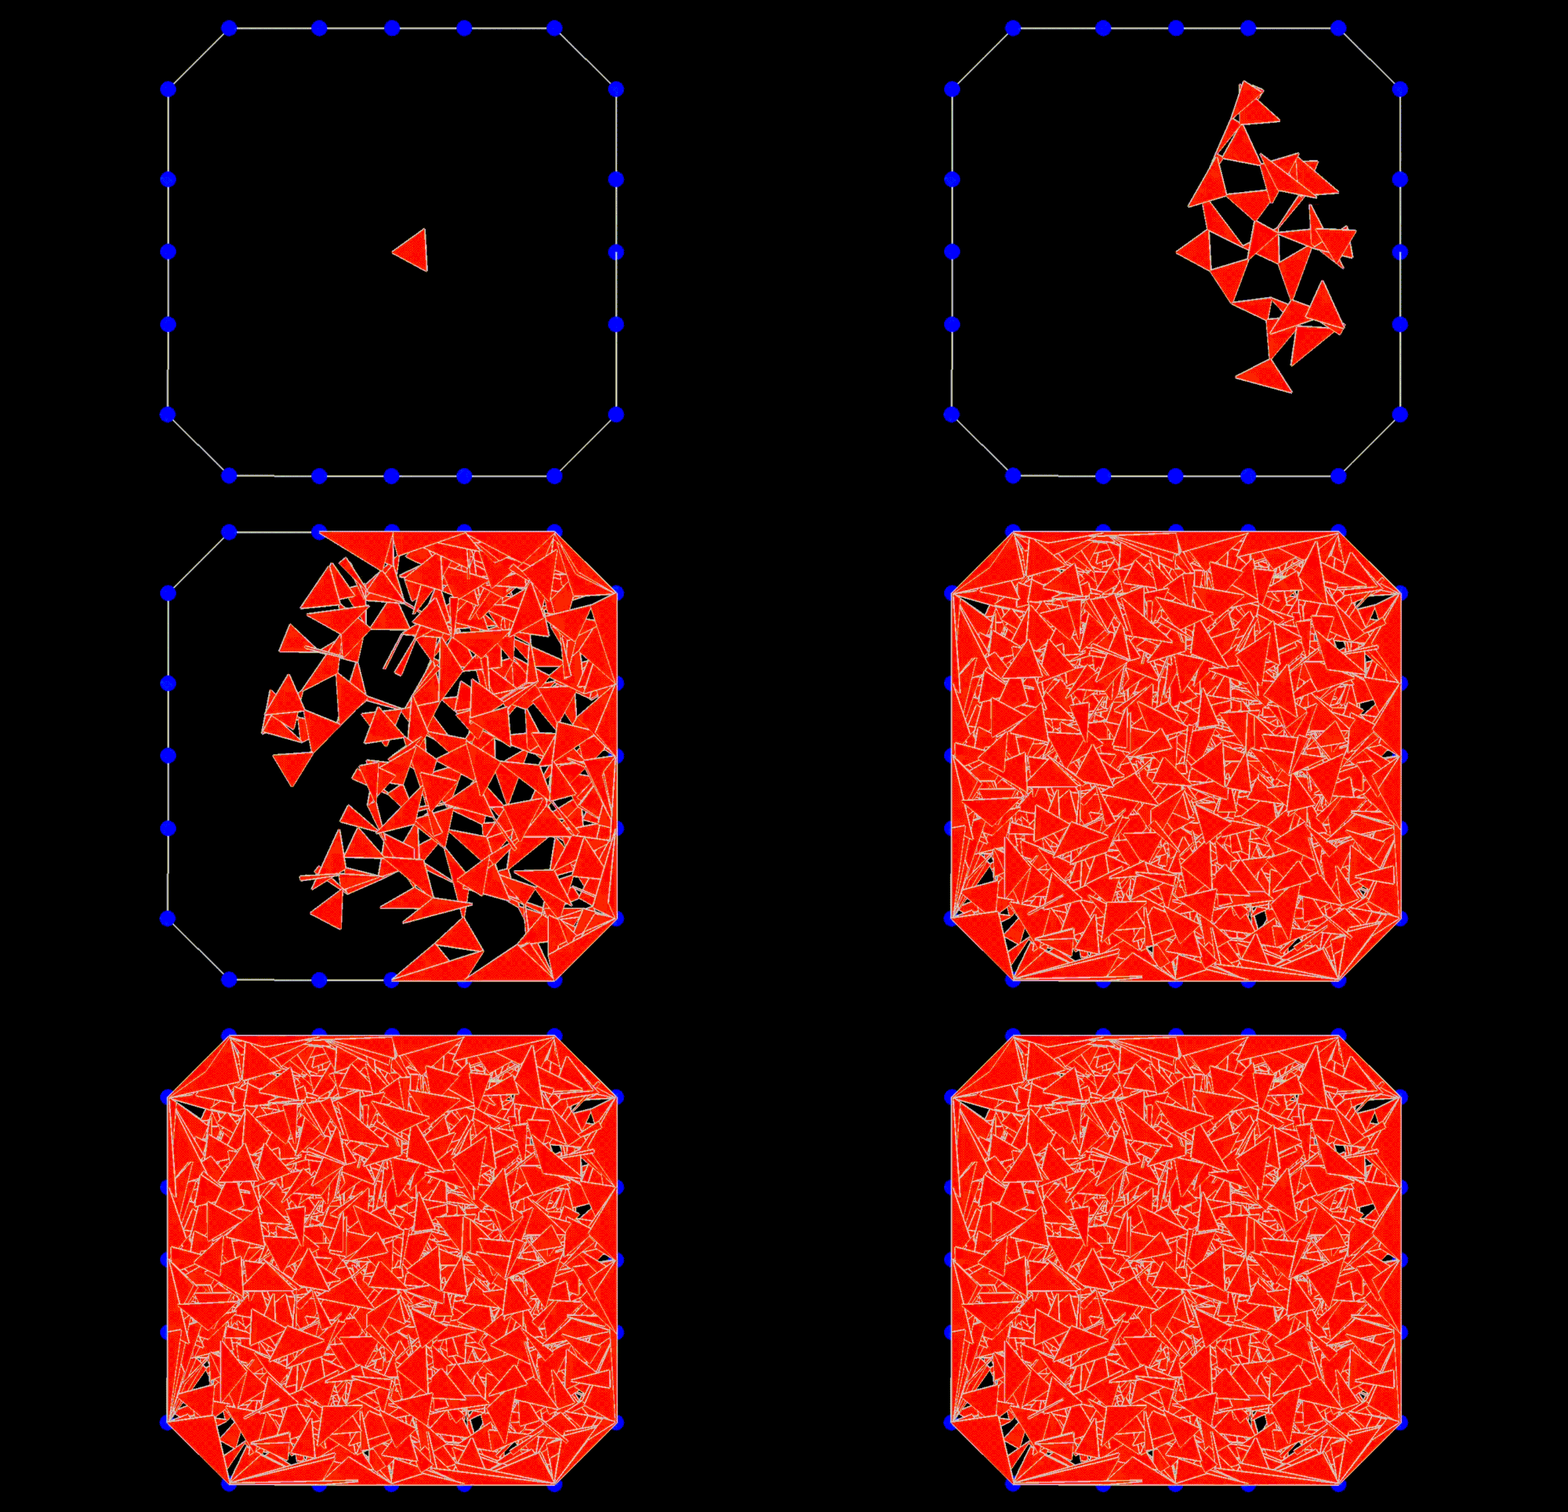
Fig 6. The mollification output for different values of \(\epsilon\) and base edge length \(c\). The red triangle drawn bottom left shows how the intrinsically mollified lengths would look extrinsically (as if the vertices were moved to match the lengths).

The animation above shows, for a triangle, how the mollification output changes with different \(\epsilon\) values and different lengths for the shortest edge in the triangle (\(c\) in this case). Moving forward, when comparing with other Mollification schemes, we may refer to the Original Mollification scheme as the Constant Mollification scheme.

4.2 Local Mollification

One may think that the Constant Mollification scheme is wasteful as it mollifies all mesh edges. Usually, the mesh has many fine triangles and only a few low-quality ones. Therefore, we thought it is worth investigating more involved ways to mollify the mesh.
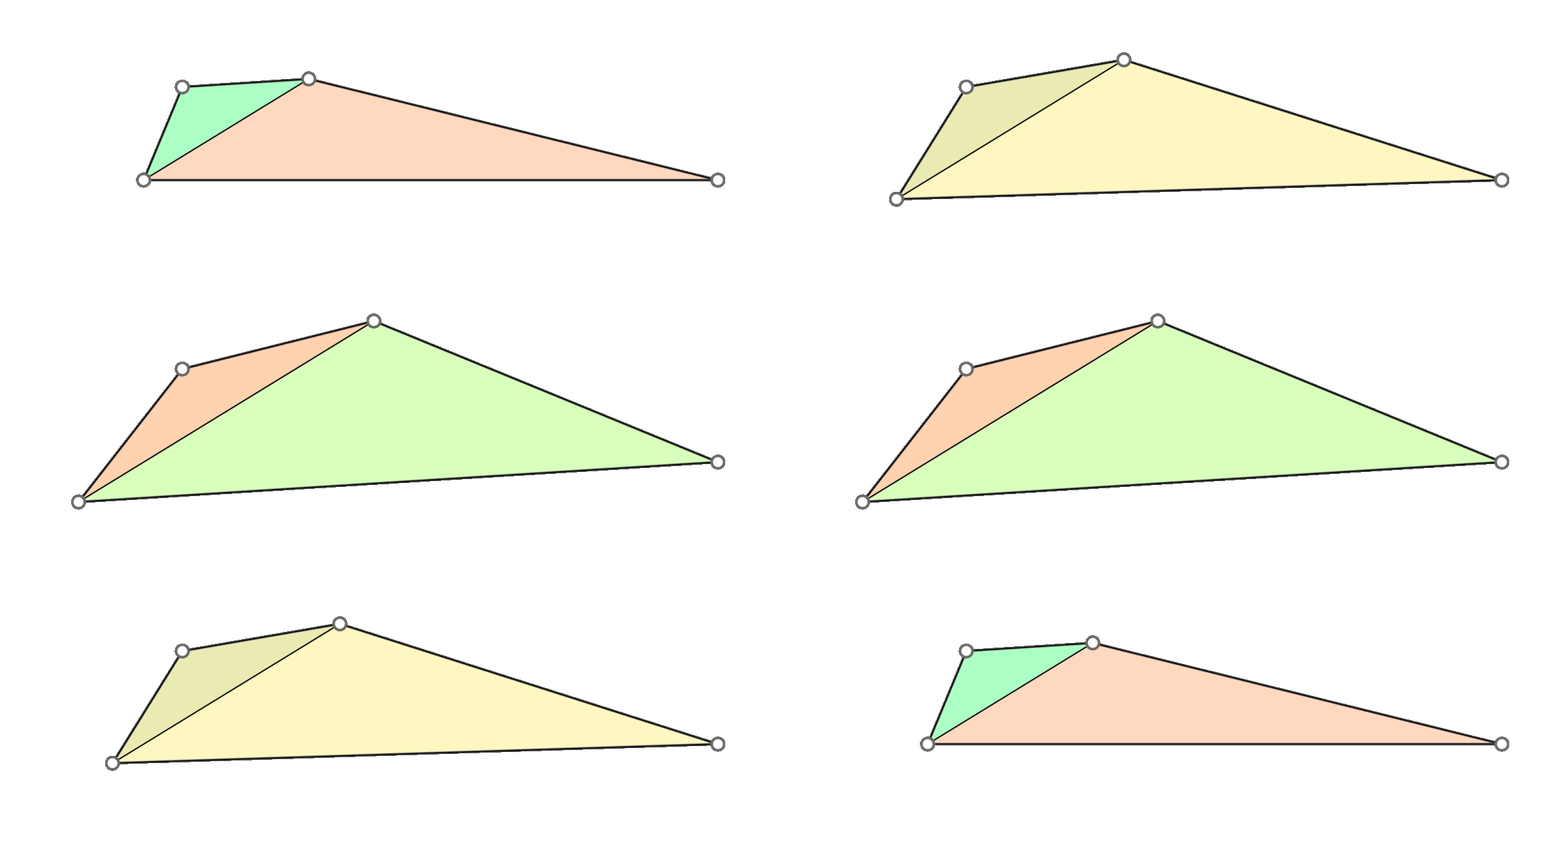
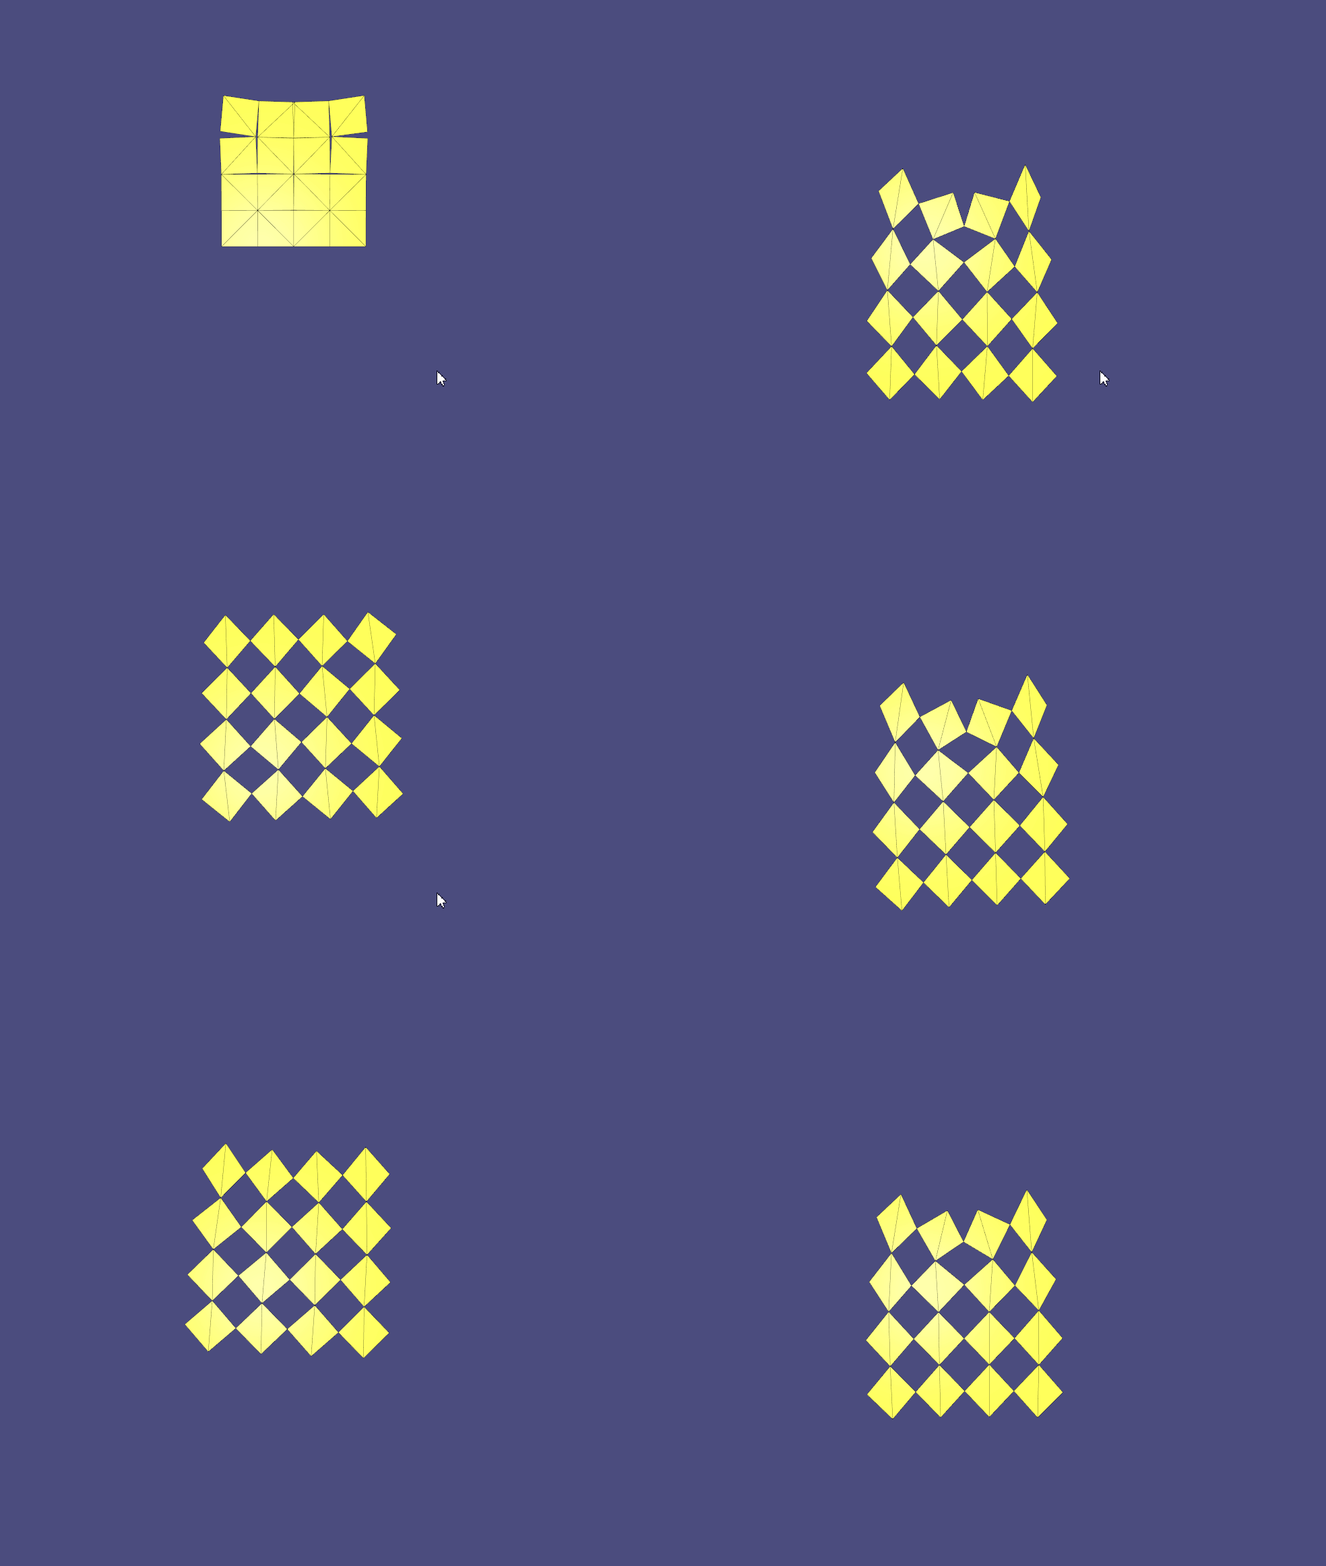
Fig. 7. Mollifying one face can make another face skinny (red), becoming in need of (more) mollification too.

A naive approach is to go through all triangles and mollify only the skinny ones. However, while mollifying a triangle, the lengths of the adjacent triangles will change. Therefore, the triangles that were fine before may become violate the condition after mollifying the adjacent triangles. So, a naive loop over all triangles will not work, and it is not even clear that this approach will converge. The animation above shows a simple example of this case.

We had an idea to mollify each face independently. That is, we mollify each face as if it were the only face in the mesh. This breaks the assumption that the mollified length of any edge is equal on both sides of it (in its adjacent faces). The idea of having disconnected edges might be reminiscent of Discontinuous Galerkin methods and Crouzeix-Raviart basis functions.

Fig 8. By allowing the mollified edge length to be 2 different values for its 2 sides (halfedges), we can mollify each face independently from its neighbors.

The algorithm for this approach is basically the same as the original one, except that we find \(\varepsilon\) for each face independently. We call this approach the Local Constant Mollification scheme. Here, it might sound tempting to let \(\delta\) vary across the mesh by scaling it with the local edge length average. However, this did not work well in our experiments.

It is reasonable to think that breaking edge equality might distort the geometry of the mesh, but it is not clear how much it does so compared to other schemes as they all introduce some distortion including the Constant Mollification one. This is discussed in the section 5.3.

4.3 Local One-By-One Mollification
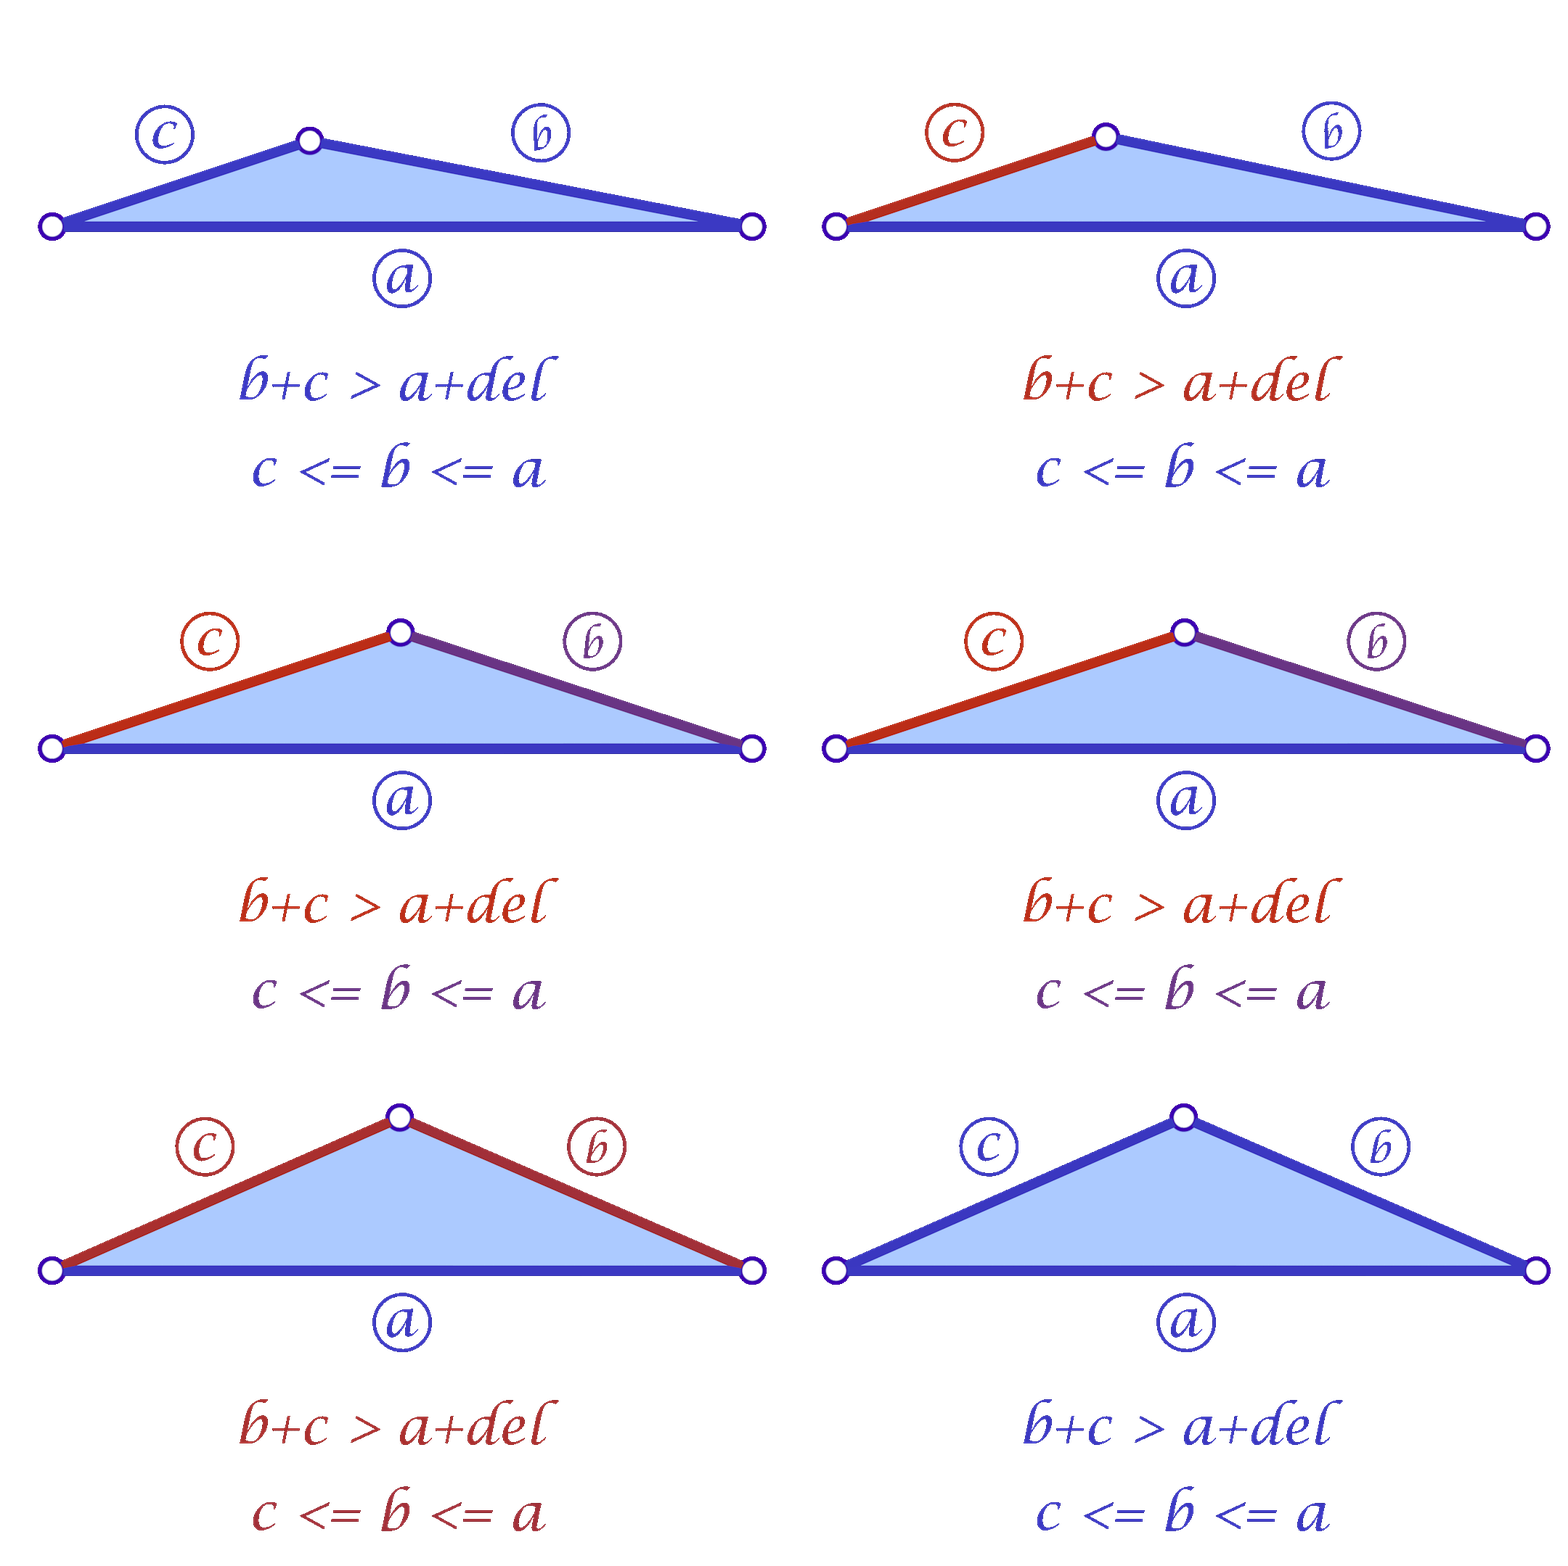
Fig. 9. The Greedy Mollification Process. The smallest edge (\(c\)) is mollified till the needed \(\delta\) is satisfied, the other edges might also be mollified to make sure \(c \le b \le a\) holds.

Since we are considering each face independently, we now have more flexibility in choosing the mollified edge lengths. For a triangle with edge lengths \(c \le b \le a\), one simple idea is to start with the smallest length \(c\) in the face and mollify it to a length that satisfies the inequalities described in the original scheme. To mollify \(c\), we simply need to satisfy:

\(c + b \ge a + \delta \quad\text{and}\quad c + a \ge b + \delta\)

After mollifying \(c\), it is easy to prove that we only need to keep \(a \ge b \ge c\) for the third inequality to hold. This scheme can be summarized in the following 3 lines of code:

c = max(c, b + delta - a, a + delta - b)
b = max(b, c)
a = max(a, b) 

The animation in Figure 9 above visualizes this process. We call this approach the Local One-By-One (Step) Mollification scheme.

A slight variation of this scheme is to mollify \(b\) along with \(c\) to keep differences between edge lengths similar to the original mesh; this is to try to avoid distorting the shape of a given triangle too much (of course we still want to make skinny triangles less skinny). Consider the following example. Suppose the mollified \(c\) equals the original length of \(b\). If \(b\) isn’t mollified, we would get an isosceles triangle with two edges of length \(b\). This is a big change to the original shape of the triangle as shown below. So a small mollification of \(b\) even for smaller “\(\delta\)”s might be a good idea.
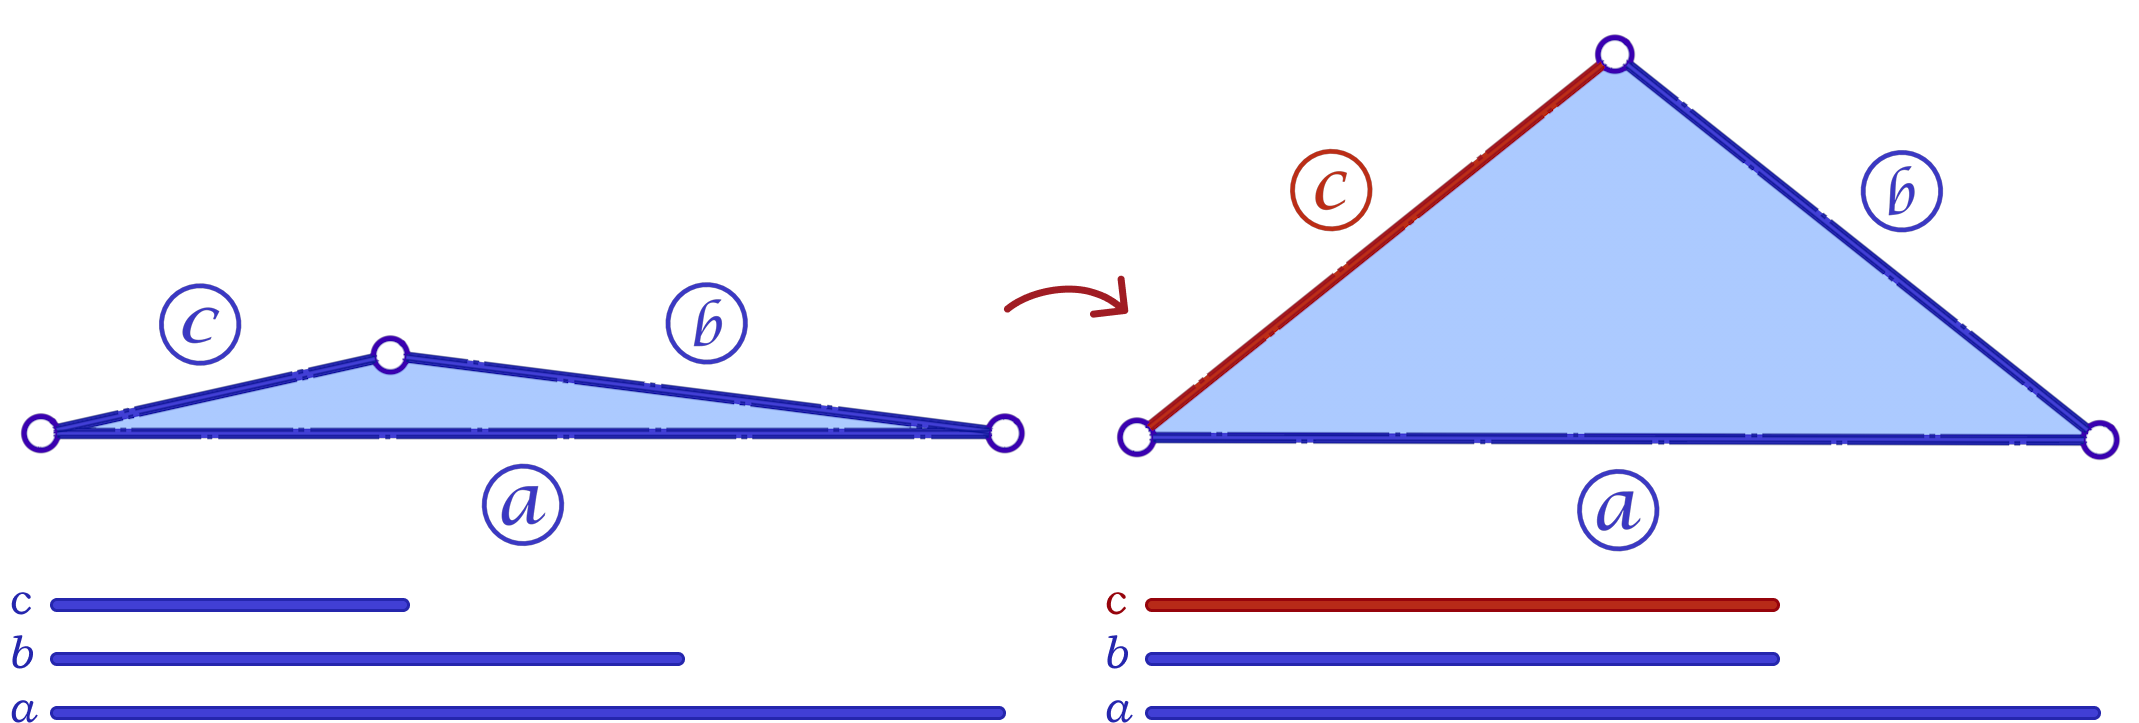
Fig. 10. Due to its discontinuous nature, the simple (step) version might change the shape of a triangle, making a (clearly) Scalene triangle an Isosceles one.

But how much should we mollify \(b\)? To keep it at the same relative distance from \(a\) and \(c\), we can use linear interpolation. That is, if \(c_o\) was mollified to \(c_o + eps_c\). we can mollify \(b_o\) to \(b_o + eps_b\) where

\(eps_b = eps_c * \frac{a_o – b_o}{a_o – c_o}\)

We call this approach the Local One-By-One Interpolated Mollification scheme. It can be summarized in the following 4 lines:

c_o = c
c = max(c, b + delta - a, a + delta - b)
b = max(c, b + (c - c_o) * (a - b) / (a - c_o))
a = max(a, b)

One more advantage of this interpolation is that it makes the behavior of \(b\) mollification smoother as \(\delta\) changes; This is visualized by the animation below.
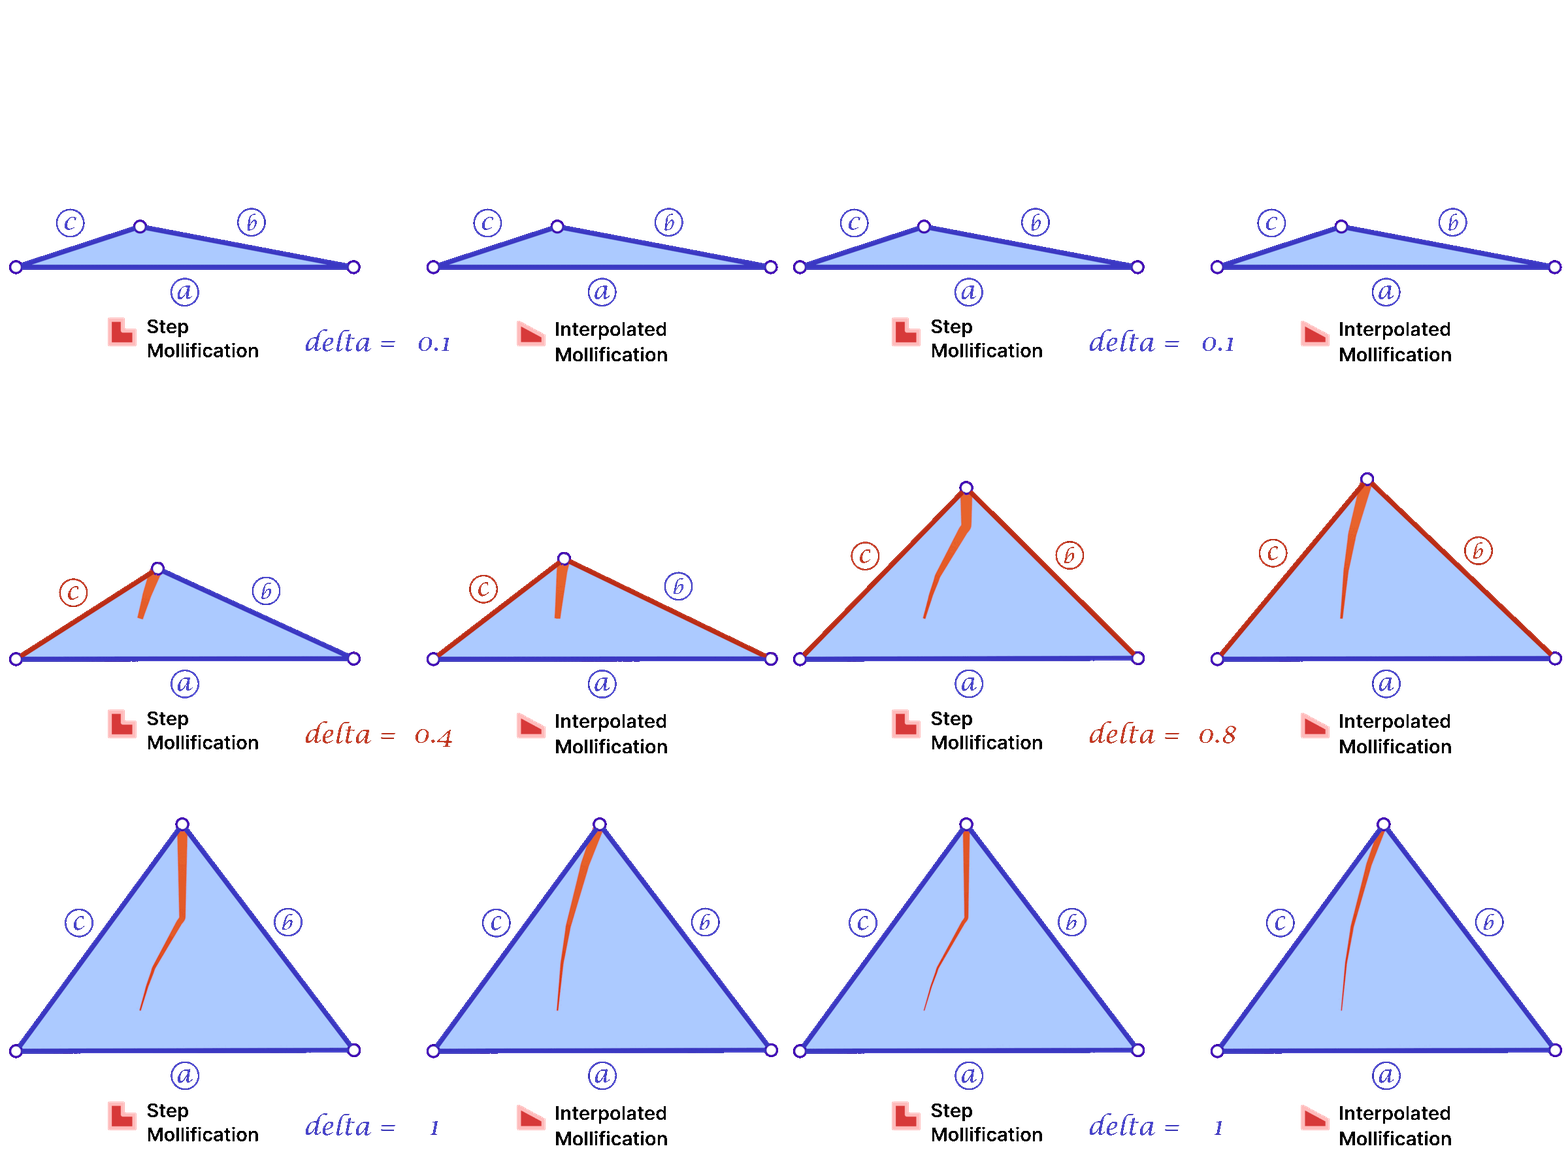
Fig. 11. Showing how the output of each of the 2 greedy versions changes as a function of 𝛿.

Another perspective on the behavior difference between both versions is to look at different cases of skinny triangles mollified with the same \(\delta\) value. As shown below, the Interpolated version would try to lessen the distortion in shape to keep it from getting into an isosceles triangle very quickly. Thus, having more variance in the mollified triangles’ shapes.
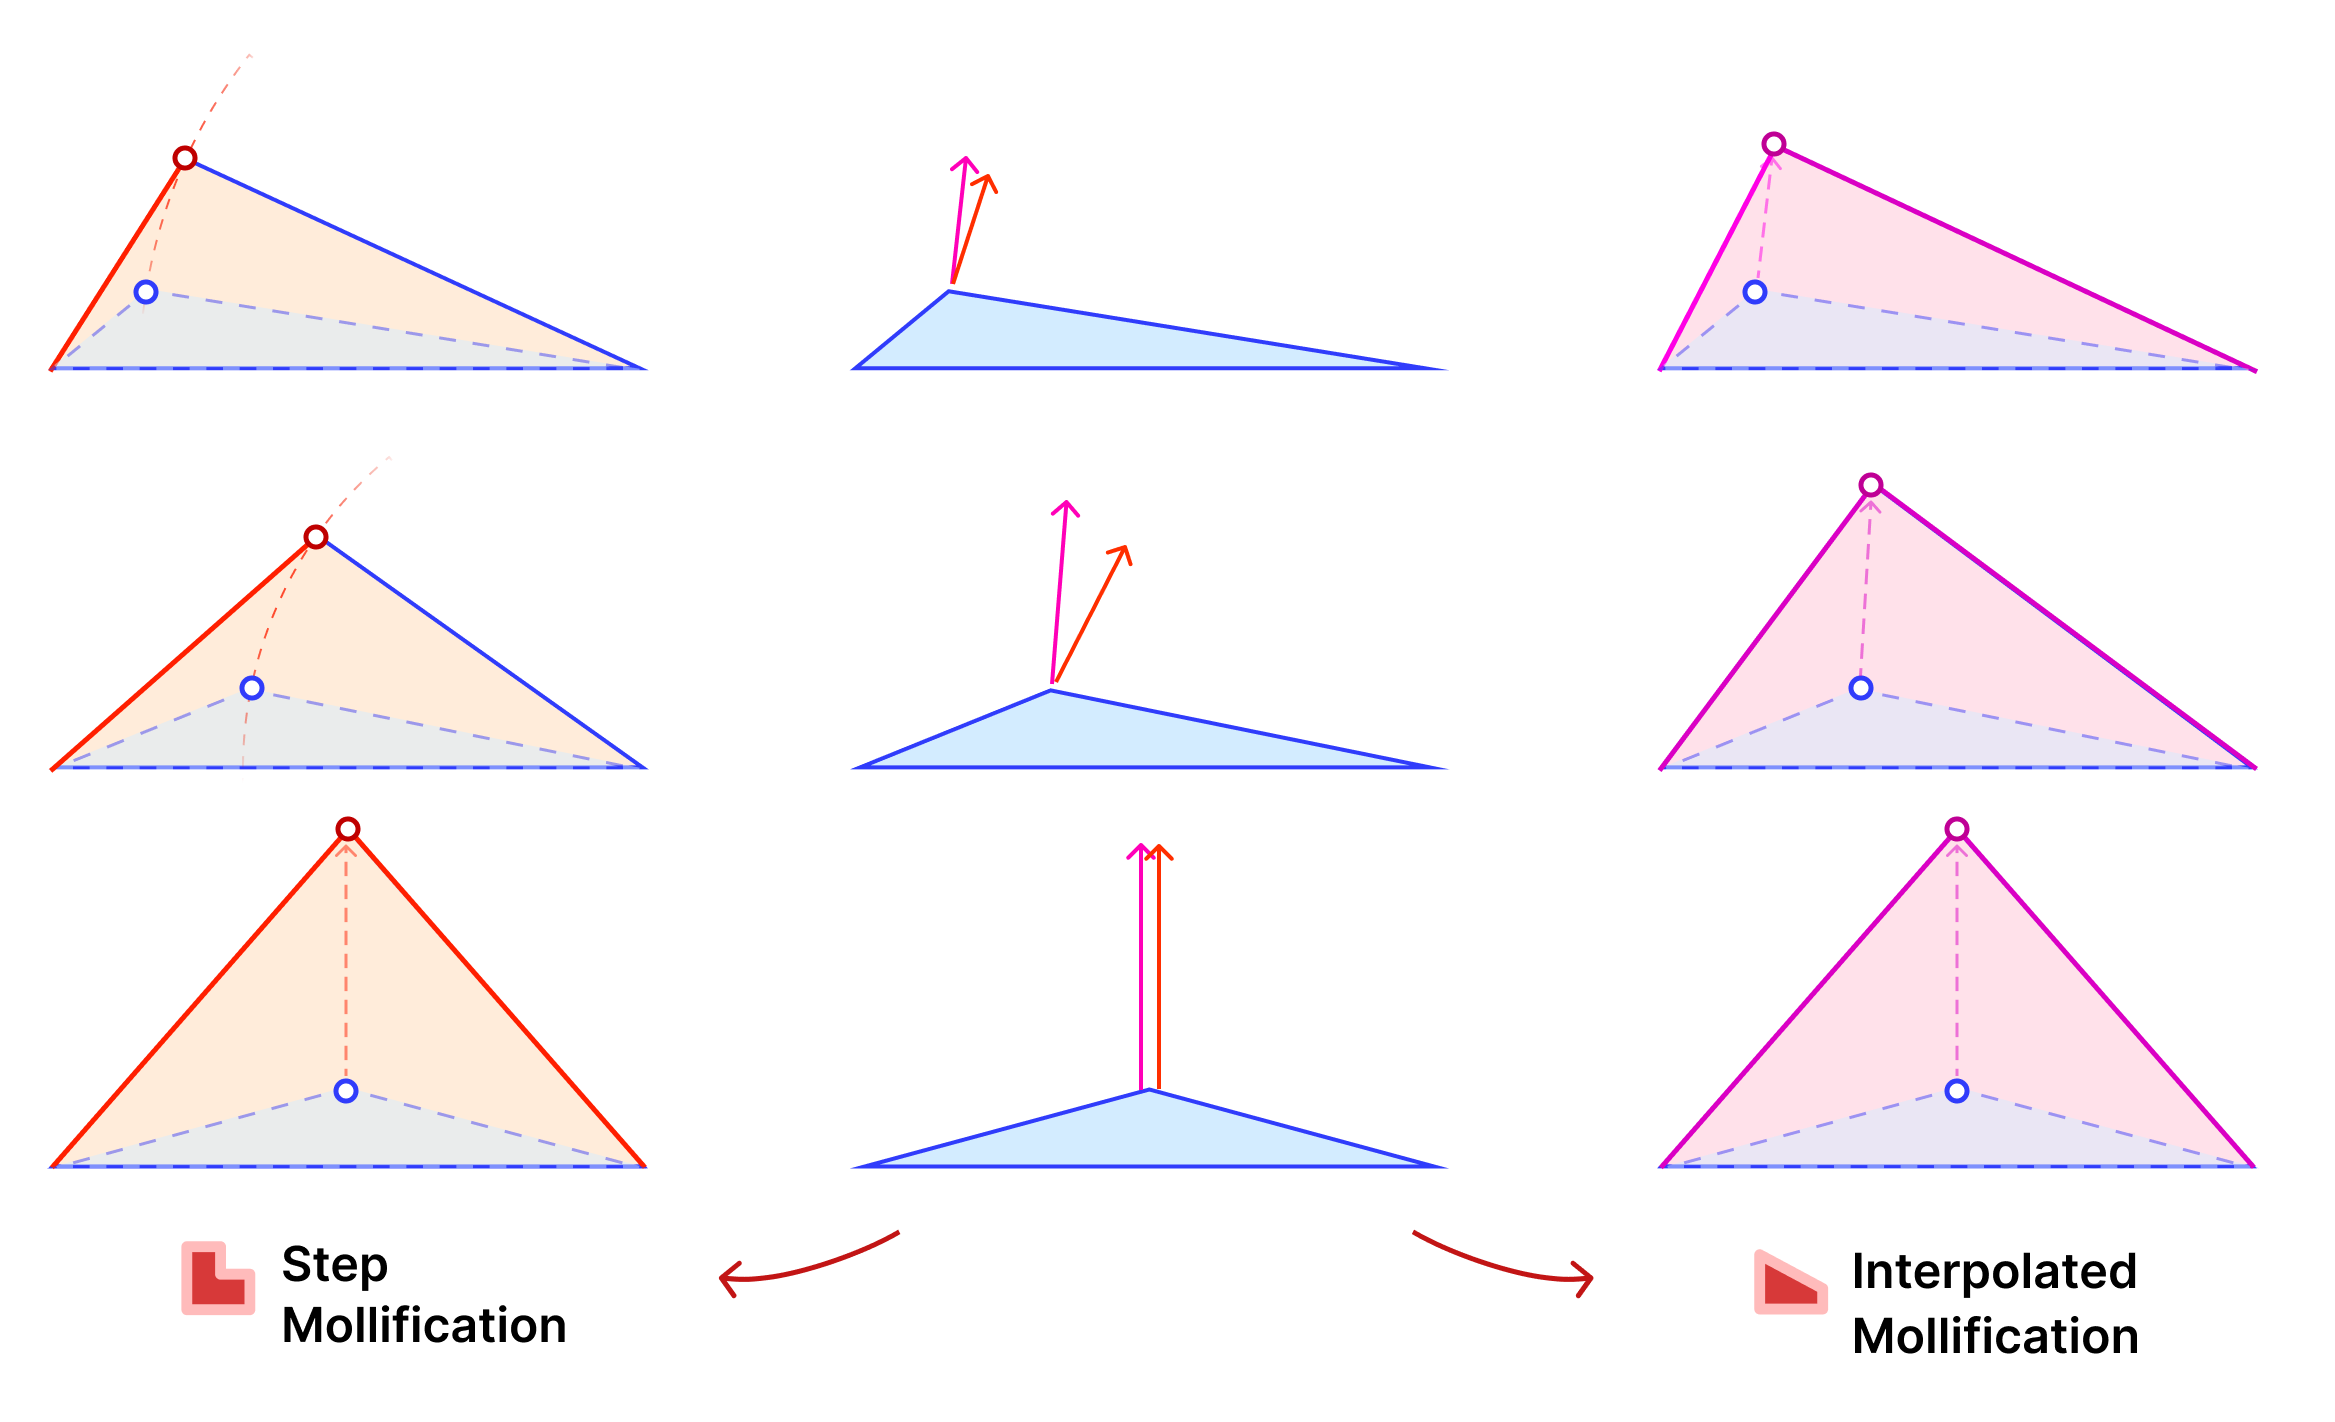
Fig. 12. The 2 One-By-One versions applied on a variety of skinny triangles. the “Step” one gets to the isosceles case quickest, while the “Interpolated” one affects the ratios between edges much less.

A great property of both schemes over the constant ones is that \(\delta\) does not need to go to ∞ in order to approach an equilateral configuration. In fact, we can prove that the mollified triangle is guaranteed to be equilateral if \(\delta \ge {a – c}\).

4.4 Local Minimal Distance Mollification
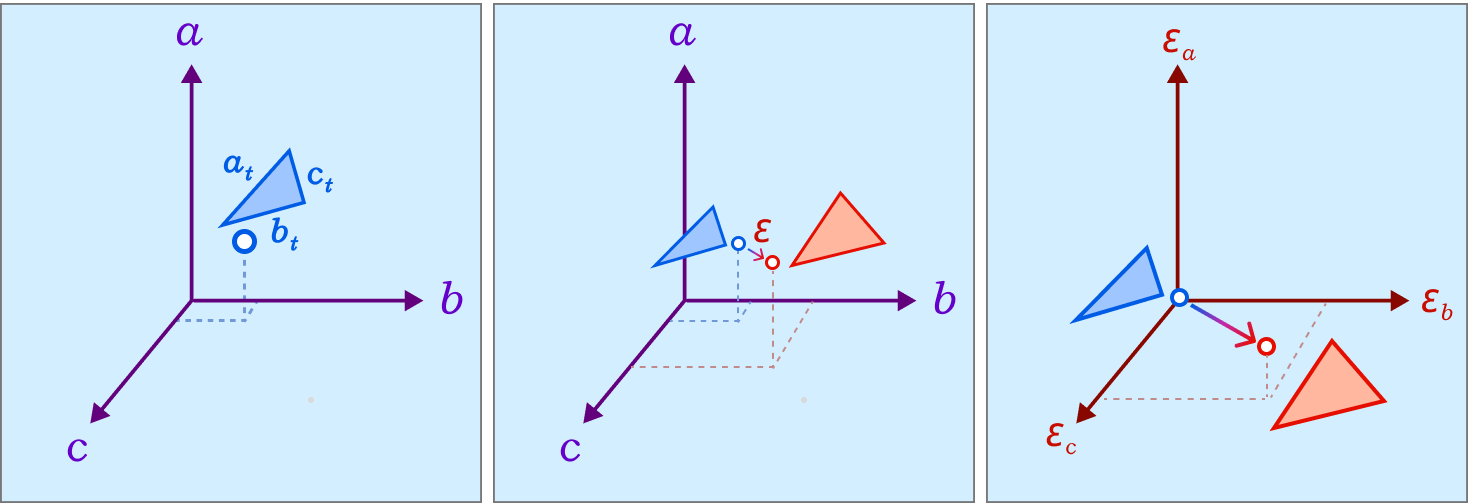
Fig. 13. The coordinate space of triangle lengths, where each point represents a triangle (left). Mollification can be thought of as a vector from the original triangle to the resulting one (middle). By placing the original triangle at the origin, the coordinates of the mollified triangle represent the \(\varepsilon\) values and are all in the first octant (right).

Even with the one-by-one schemes, We don’t have a guarantee that the triangle mollification is minimal. By minimal we mean that the mollified triangle is the closest triangle to the original triangle in terms of edge lengths. This is because greedy schemes don’t look back at the previous edge lengths and potentially reduce the mollification done on them.

A good result from working with intrinsic lengths is that it is easy to deal with one triangle at once if we think about each edge as an independent variable. Then, the original triangle is a point in the space of edge lengths and the mollified triangle is another one. Since we are only adding length, it is easier to think of the original triangle as the origin point of this space and all vectors would represent the added length to each edge. Thus, the 3 axes now represent each edge’s \(\epsilon\). This is illustrated in the Figure above.

The problem of finding the minimal mollified triangle is then a problem of finding the closest point to the original triangle in this space inside the region defined by 6 constraints (triangle inequalities & non-negativity of epsilon). These make up a 3D polytope as shown below.

Fig 14. The intersection of the 3 mollification inequalites results in a tetrahedral-like region independent of the specific triangle at hand (left). One triangle represents a point in the length space and the has 3 dependent ineuqallities (right) restricing mollification to positive \(\varepsilon\). The 6 ineuqalities together make the constraint region.

Depending on how we define the distance between two triangles, this problem can be solved using Linear Programming or Quadratic Programming. We can define the distance between two triangles as the sum of the distances between each corresponding edge of both triangles, this distance is just the \(L_1\) norm (Manhattan) of the difference between the edge lengths of the two triangles. This is a linear function of the edge lengths. Therefore, the problem of finding the minimal mollified triangle is the following Linear Programming problem:

\(\begin{gather*}
\text{min} \quad
I_{3 \times 1} \cdot x \\
\\
\text{s.t.} \quad
\begin{pmatrix} 1 & 1 & -1 \\ 1 & -1 & 1 \\ -1 & 1 & 1 \\ 1 & 0 & 0 \\ 0 & 1 & 0 \\ 0 & 0 & 1 \end{pmatrix} x =
\begin{pmatrix} \delta \\ \delta \\ \delta \\ 0 \\ 0 \\ 0 \end{pmatrix} \\ \end{gather*}\)

The first 3 rows correspond to the 3 triangle inequalities, and the other 3 restrict mollification to positive additions to the length.

In the other case, where we define the distance between two triangles as the \(L_2\) norm (Euclidean) of the difference between the edge lengths of the two triangles, the problem of finding the minimal mollified triangle is a Quadratic Programming problem. The constraints are still the same, the only difference is that we minimize \(x^T x\) instead of \(I_{3 \times 1} \cdot x\). The good news is that both problems can be solved efficiently using existing solvers. The figure above visualizes both concepts.

With these 2 versions, we have two more schemes, namely, the Local Minimal Manhattan Distance and the Local Minimal Euclidean Distance mollification schemes

4.5 Sequential Pooling Mollification
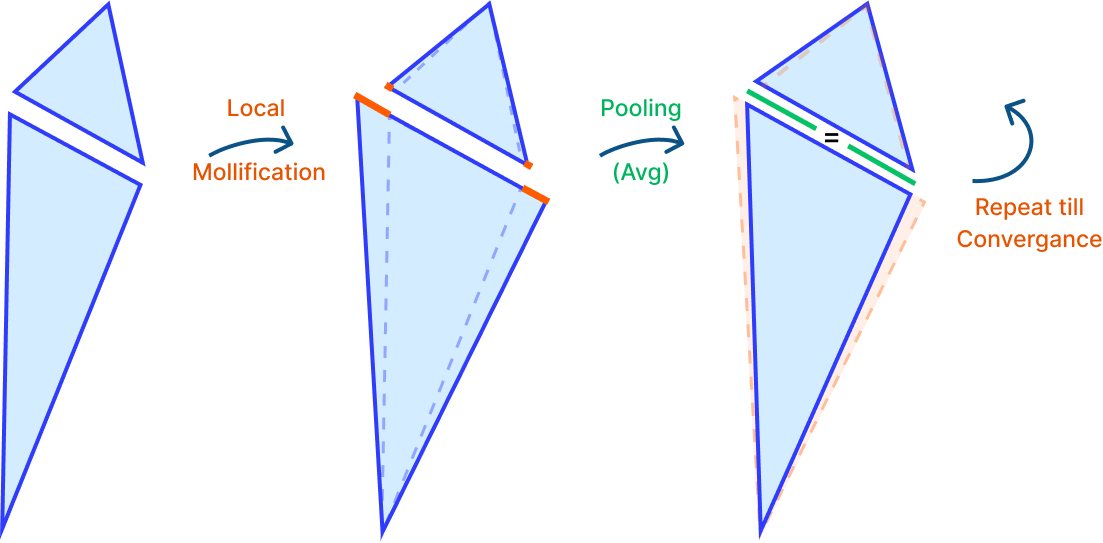
Fig. 15. The process of repeatedly mollifying and averaging (pooling) till convergance.

After exploring a lot of different local mollification schemes, we thought it would be a good idea to try to get the advantages of local mollification schemes (like significantly reducing the total mollification) while still keeping the edge lengths on both sides equal. The first idea that came to mind was to mollify the mesh using local scheme, and then average the mollified edge lengths on both sides of each edge. And repeating this process until convergence. The figure above visualizes this idea.

When we tried this idea on a few meshes, we noticed that the mollification process was not converging. We tried other pooling operations like Max, Min, and combinations of them. Unfortunately, none of them were converging. It might be worth it to put some time into trying to derive different pooling functions with convergence guarantees.

4.6 Global Optimization Mollification

In the search for a scheme that has a lot of the good properties of the local schemes, while keeping edge lengths on both sides equal, we took the idea of finding the closest mollified triangle to the original triangle in terms of edge lengths, but instead of doing it locally, we will apply the problem to all mesh edge lengths at once.

This also involves solving a Linear Programming or Quadratic Programming problem based on the distance function we choose. We call the global versions the Global Minimal Manhattan Distance and the Global Minimal Euclidean Distance Mollification. Effectively, this is finding the least amount of mollification while not breaking the equality of edge lengths on both sides.

4.7 Post-mollification Normalization

Since we are always adding length in mollification, Properties that aren’t scale invariant might get scaled. In order to avoid this, we might want to scale the mollified edge lengths down so that the total surface area is the same. This would not make a difference for the Cotan-Laplace Matrix but it can a difference for the Mass Matrix (among other things).

For some applications, it would make sense that we want a different quantity to remain unchanged after the mollification. For example, To keep the geodesic distances from getting scaled up, we can normalize the mollified edge lengths so that the total edge length is the same after mollification. for each mollified edge length \(e^i_{mol}\):

\(e^i_{mol}- = e^i_{mol} * \frac{\sum_{j = 1}^{|E|} e^j_{mol}}{\sum_{j = 1}^{|E|} e^j}\)

We implemented this step in our C++ implementation and used it in the Geodesic Distance Benchmarks in.

5. Experiments and Evaluation

5.1 Data Sets for Benchmarks
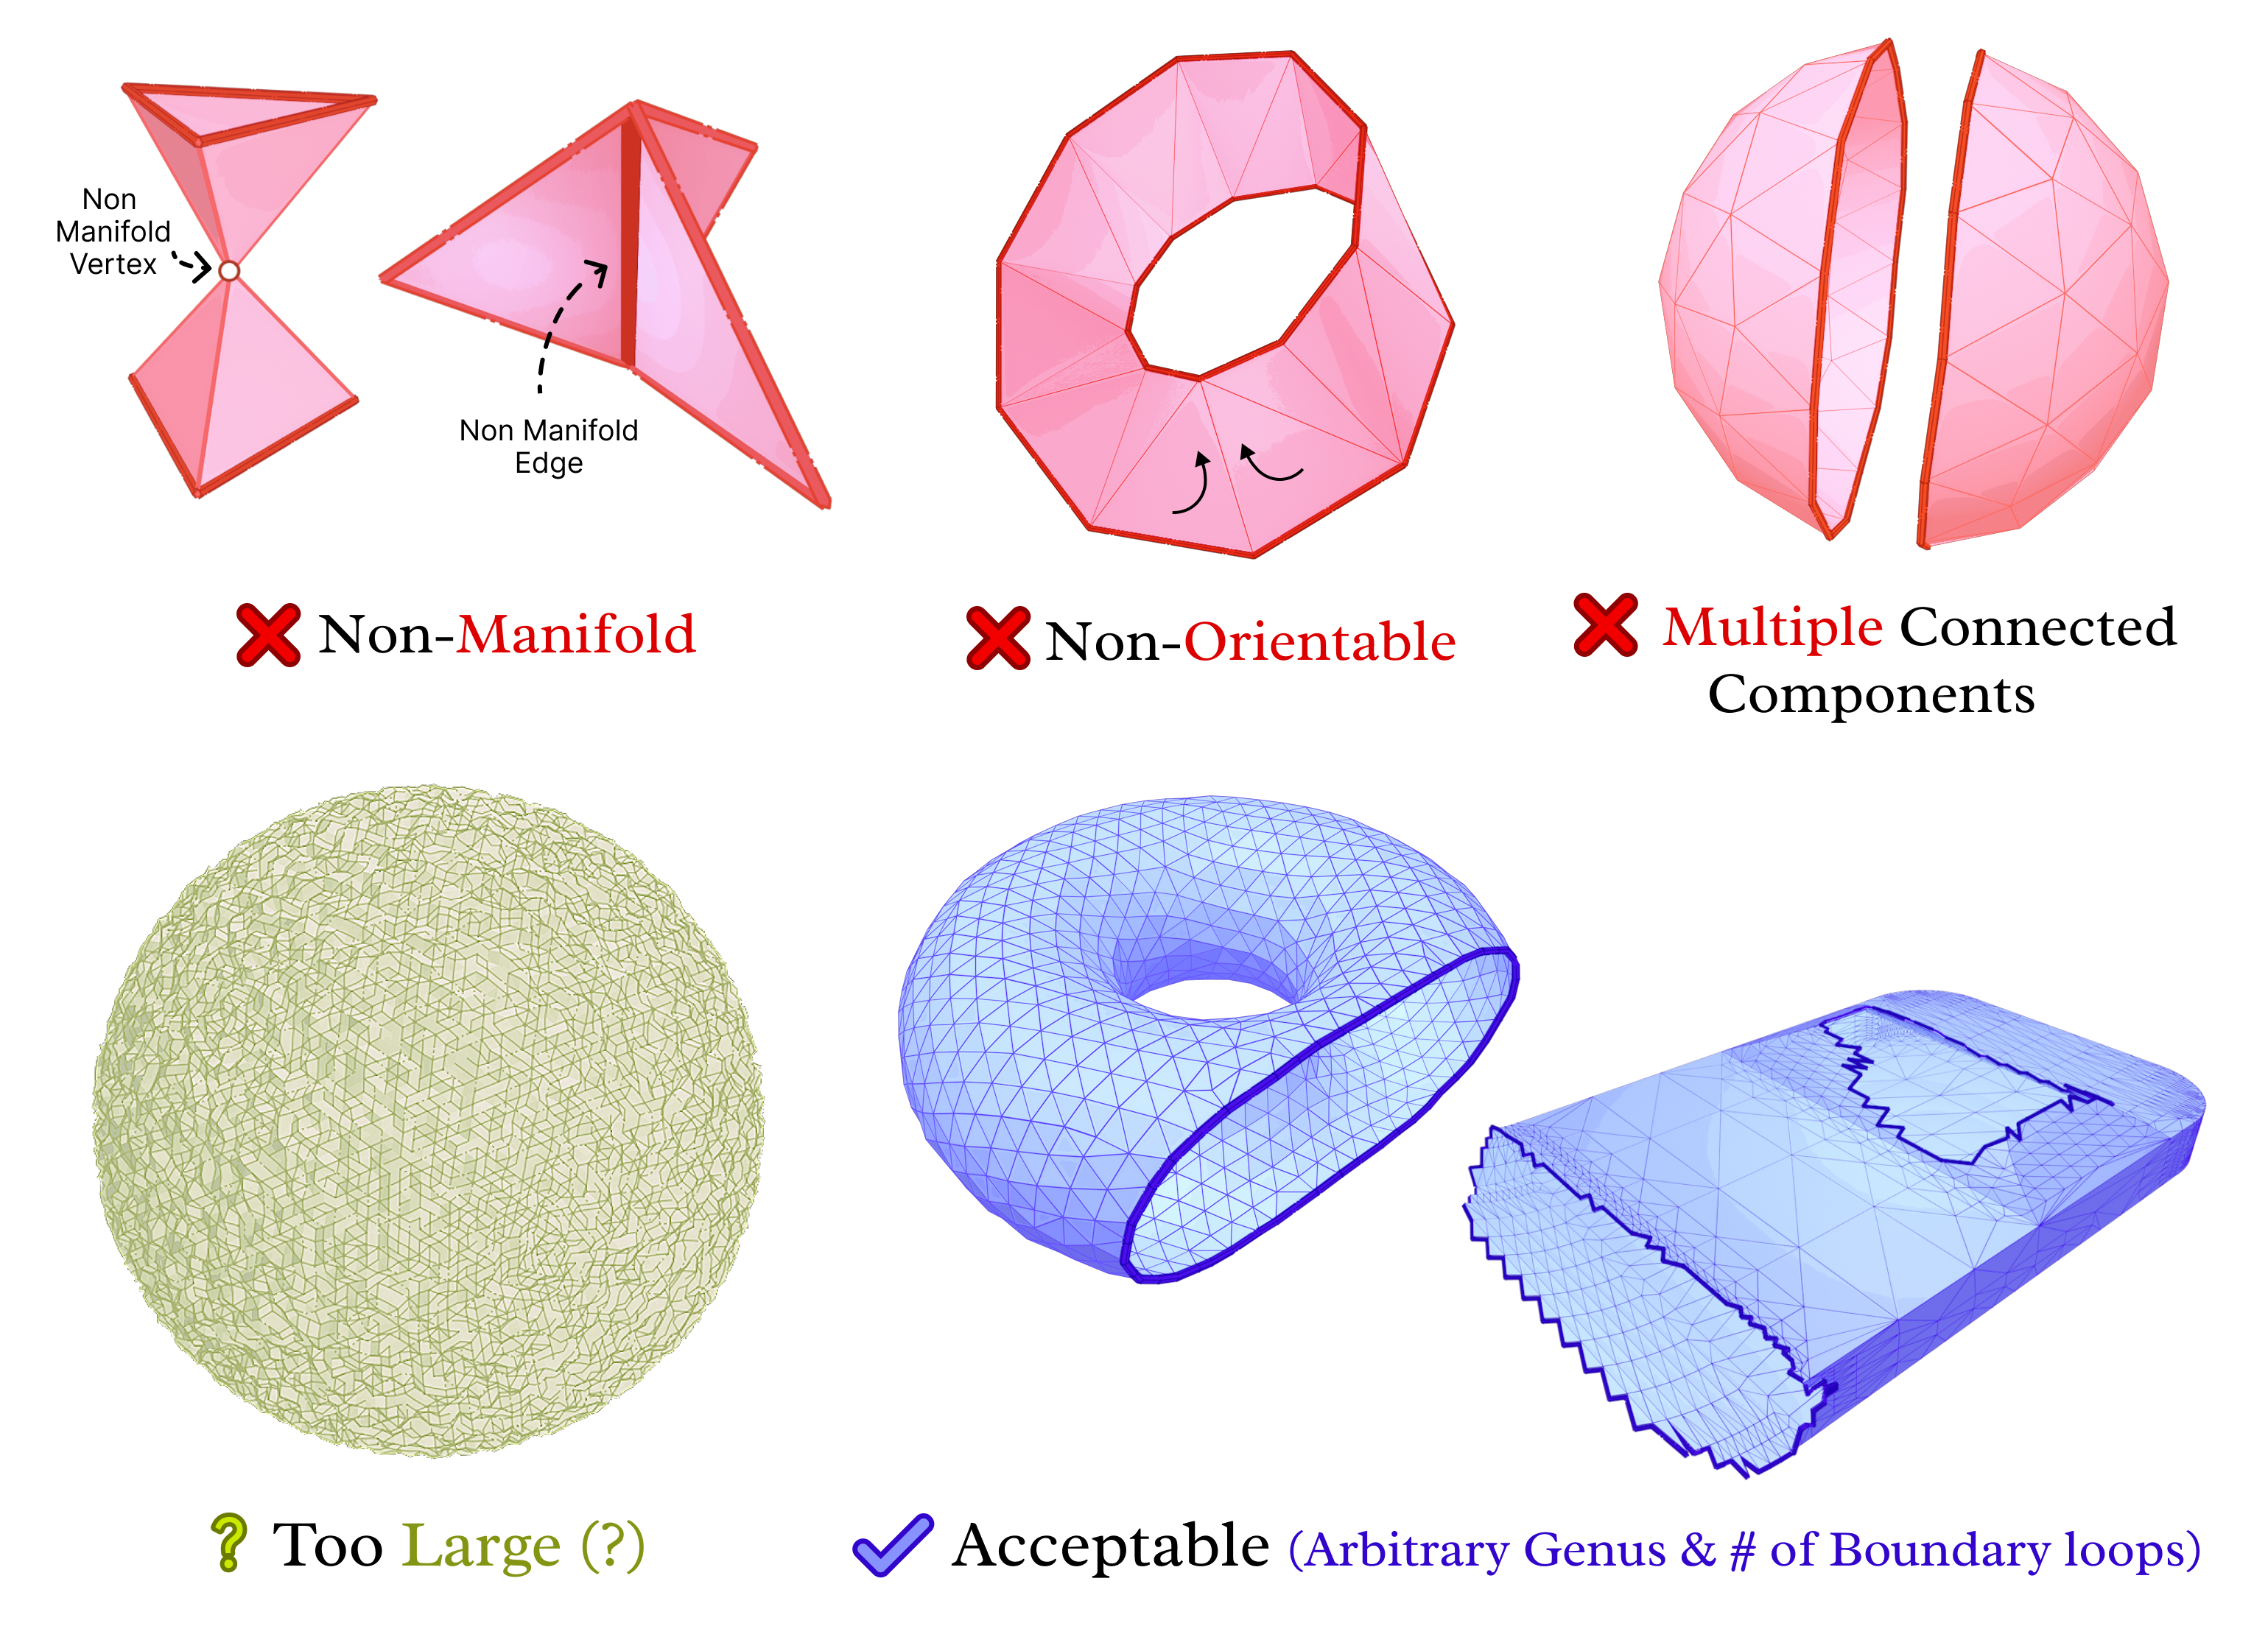
Fig. 17. Thingi10K Filtered. Acceptable meshes can have arbitrary genera, number of connected components, and geometry. It is worth noting that this and other illustrations were inspired by Keenan’s work on his courses and in [7].

For most experiments, we use the Thingi10k data set [8]. It is composed of 10,000 3D models from the Thingiverse. The models have a wide variety of triangular meshes. This variety comes in regards to Manifoldness, genus, number of components and boundary loops, and more. A lot of the meshes also have very bad quality triangles. So, it is suitable for testing our work on a wide range of scenarios.

We implemented a script to filter the data set. In particular, we removed not manifold, multiple-component, and non-oriented meshes. The remaining meshes are categorized based on the size of the mesh and the number of skinny triangles (i.e. ones that violate the mollification inequalities). This step was very helpful for testing and debugging the different aspects of the proposed work quickly by choosing the appropriate meshes. The Figure above shows examples of acceptable and filtered-out meshes. For most of the benchmarks, we used this filtered data set . In some cases, we filtered out large meshes (i.e. \(\|F\| > 20,000\) triangles) to reduce the running time of the experiments. The graph below shows the (log) distribution of the number of faces used for some of the benchmarks.
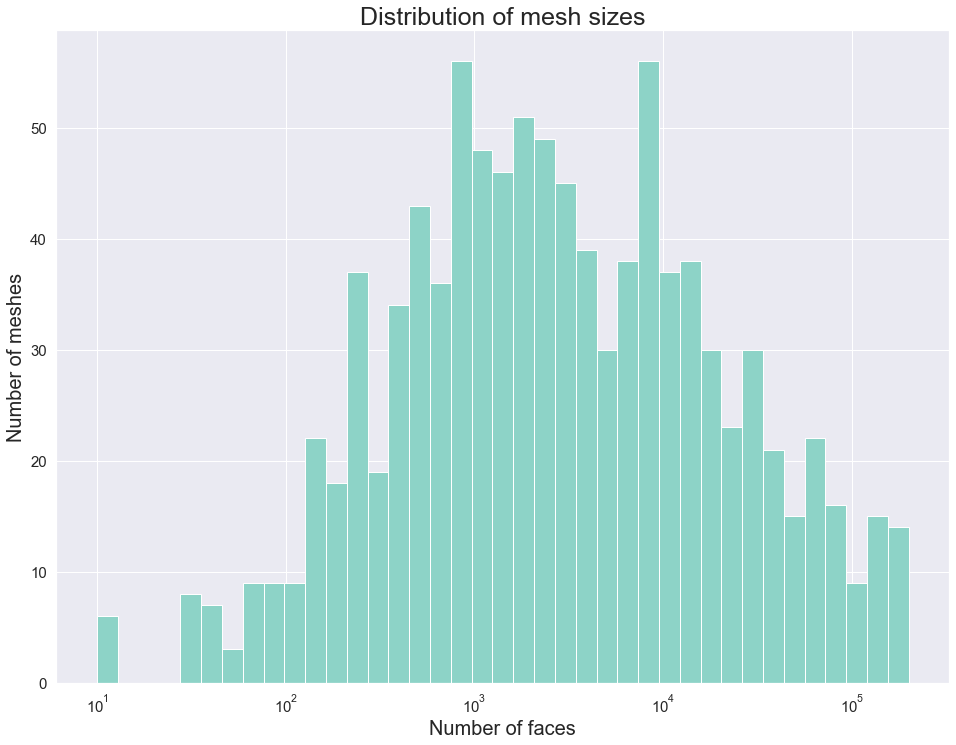
Fig 18. Filtered Thingi: a histogram of face counts. With a logarithmic x-scale, It seems very close to a log-normal distribution.

In search for other data sets to evaluate the proposed work, “A Dataset and Benchmark for Mesh Parameterization” [9] has an interesting set of triangular meshes used to benchmark parameterization schemes. As described, Thingi10k meshes come from real data, usually used for 3D printing and video game modeling but the data is not particularly suitable for testing parameterization methods. Since mollification will be important for parameterization methods, the investigation of further data sets is needed.

Progressive parameterizations” [10] presents a data set which has been used before in the literature for benchmarking parameterization methods. However, [10] data is composed of meshes based on artificial objects. In this case, [9] obtain and makecorrection corrections on meshes from multiple sources, including the Thingiverse, which are mainly obtained from real-world objects and form the set called Uncut. Then, in possession of the Uncut, they perform cuts along the artist’s seam to form the set called Cut. . Due to time limits, The parameterization benchmarks currently reported are still on Thingi10k (with some work to extract patches). But, it may be worth it to use Cut for the parameterization benchmarks in the future.

5.2 Alternative Strategies

The effects of badly shaped triangles have been present since the early days of mesh generation. A common appearance of these effects is on Surface Parameterization Problems. Examples of these problems are the Least Squares Conformal Mapping and Spectral Conformal mapping, which essentially are composed of vertex transformations whose weights are in their essence non-negative. However, it is known that very thin triangles can result in parameterization weights that are negative or numerical zeros which need to be avoided.

In practice, simple heuristics have been applied to avoid non-positive conformal map weights. These are indeed simple in nature but known to be in some cases effective

  1. Replace negative weights with zero, or with absolute value
  2. Replace NaN & infinity weights with zero, or with one.
  3. Replace numerical zeros with zero.

We tried using some of these hacks and even combinations of them. Hence, Some of them turn out to be more useful and produce better results. For example, for the parameterization benchmarks, the negative replacement hacks were not useful at all. On the other hand, the NaN (& Infinity) replacement hacks are much more useful. Also, the near-zero approximation hack improves things sometimes but makes things worse more often. Overall, it is not immediately clear if any of them are better in a general sense.

For this, given an appropriate measure to be discussed in the mapping benchmarks in section 5.5.4, the Mollification schemes are compared to the best-performing combinations of these simple heuristics.

5.3 Comparison of Mollification Strategies

5.3.1 Length Distortion

First, we compare all schemes’ performance independent of any application; to see how much they affect the mesh geometry. For each mesh in Thingi10k (filtered), we compute the relative total difference between the mollified and original lengths. These differences are averaged over all meshes and reported as Avg. Added Length as a metric of length distortion. We also report the average percentage of mollified edges (for global schemes, it can not be counted explicitly).
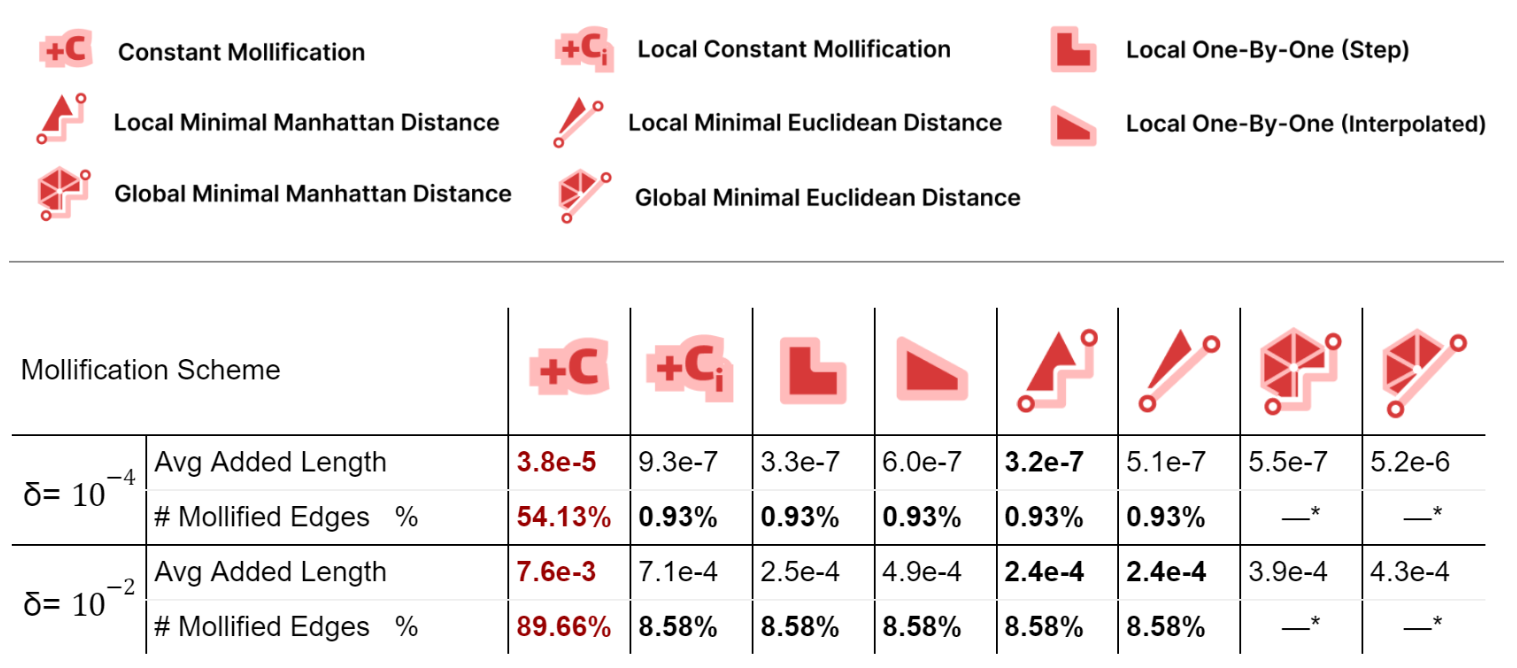
Table 1. Summarizing the effect of each Mollification scheme on the edge lengths on average.

Local schemes introduce much less mollification than the constant one as they only mollify near-degenerate faces, especially for smaller \(\delta\); due to having less strict inequalities and thus less faces violating them. The number of mollified edges is x50 times smaller for local schemes.

For the average added length, Unsurprisingly, The Local Minimal Manhattan distance scheme is always optimal. For the Euclidean distance version, it has more added length because the metric we are reporting is essentially a scaled sum of Manhattan distances for each face. Additionally, the Local 1-by-1 Step scheme is always very close to the Local Minimal Manhattan distance scheme as in most cases, we only need to mollify one edge. In such cases, Both schemes behave identically.

Compared to the step version, the Local 1-by-1 Interpolated scheme allows some more length distortion for smoother behavior over \(\delta\) values and better triangle length ratio preservation. Moreover, this distortion is still quite low compared to the Local Constant scheme.

The Global Minimal distance schemes have significantly less added length than the constant one, and more than the local analouges. But, they have the benefit of keeping the 2 sides lengths of an edge equal. The Euclidean version has a strangely larger added length than the Manhattan one for \(\delta = 10^{-4}\). This might be worth investigating further.

More than 50% of the dataset needs mollification even for forgiving \(\delta\) values, which shows that skinny triangles are common in practice. This motivates the development of mollification and other preprocessing step.

5.3.2 Time Performance

It is important to also analyze the time performance of these schemes. The table below shows the average running times for the filtered dataset meshes with \(\|F\| \le 200,000\).
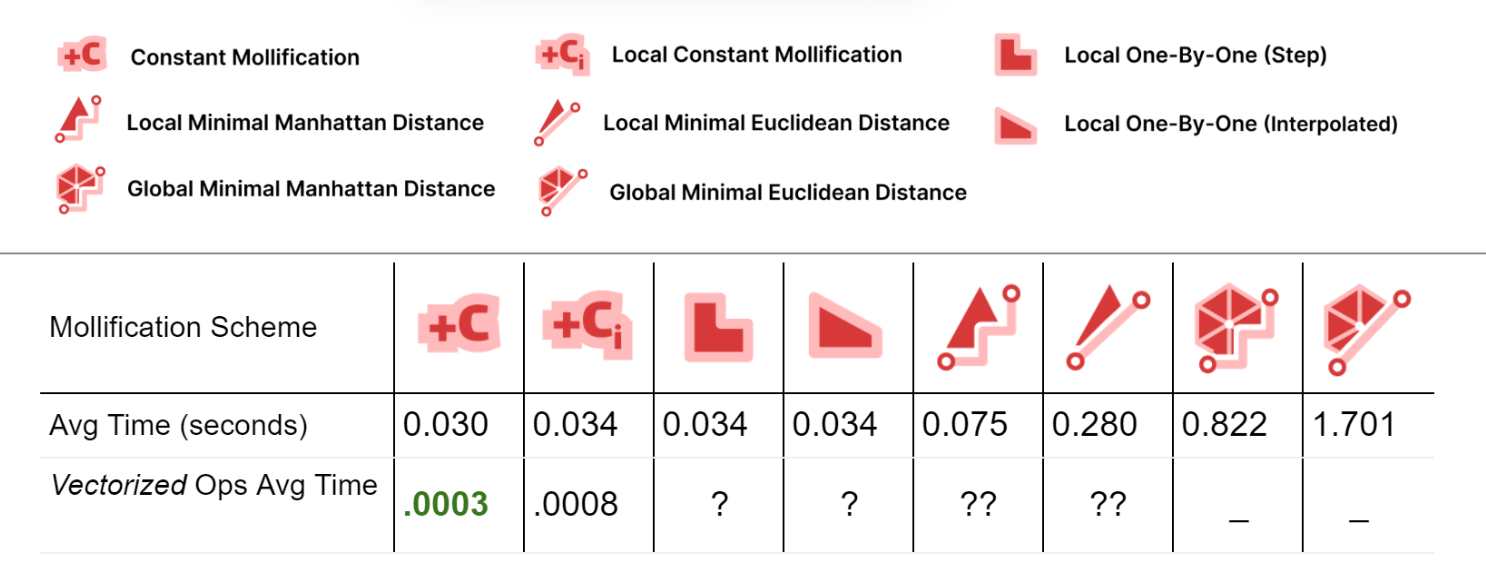
Table 2. Showing the average running time for each scheme on the filter Thingi10k dataset.

First, comparing the basic implementations (With no vectorized NumPy Operations), we see that most of the local schemes have very similar running times to the constant scheme (the fastest). This is great news because the extra steps implemented in them don’t have a large impact on the average running time.

For the Local Minimal distance schemes, they are a bit slower. But it is important to note here that we didn’t try to find the most efficient libraries for linear programming and quad programming optimizers; In fact, we used a different one for each problem (Scipy and Cvx-Opt respectively). So, for a more careful performance analysis, it would be worth trying different libraries and reviewing the implementation. It can also be beneficial to try to find a simple update rule form for them (similar to the implementation of the greedy ones). From the first glance, it sounds feasible, especially for the linear program version as it is extremely similar to the 1-by-1 step scheme.

For the global minimization schemes, they are much slower than the others. Here, the notes mentioned above about efficient optimizers also hold.

To improve the running times, we implemented the Constant scheme and the local Constant schemes using NumPy’s vectorized operations. It is clear that this made a huge difference (about x100 and x40). We didn’t have time to try to do the same for the other local schemes. But it might be achievable and it would be interesting the resulting boasts. Moreover, the local schemes are very easy to parallelize which is one more way to optimize them. Since the local schemes’ time is mostly spent iterating over the faces and checking them, they can be integrated into the Laplacian computation loop directly to save time.
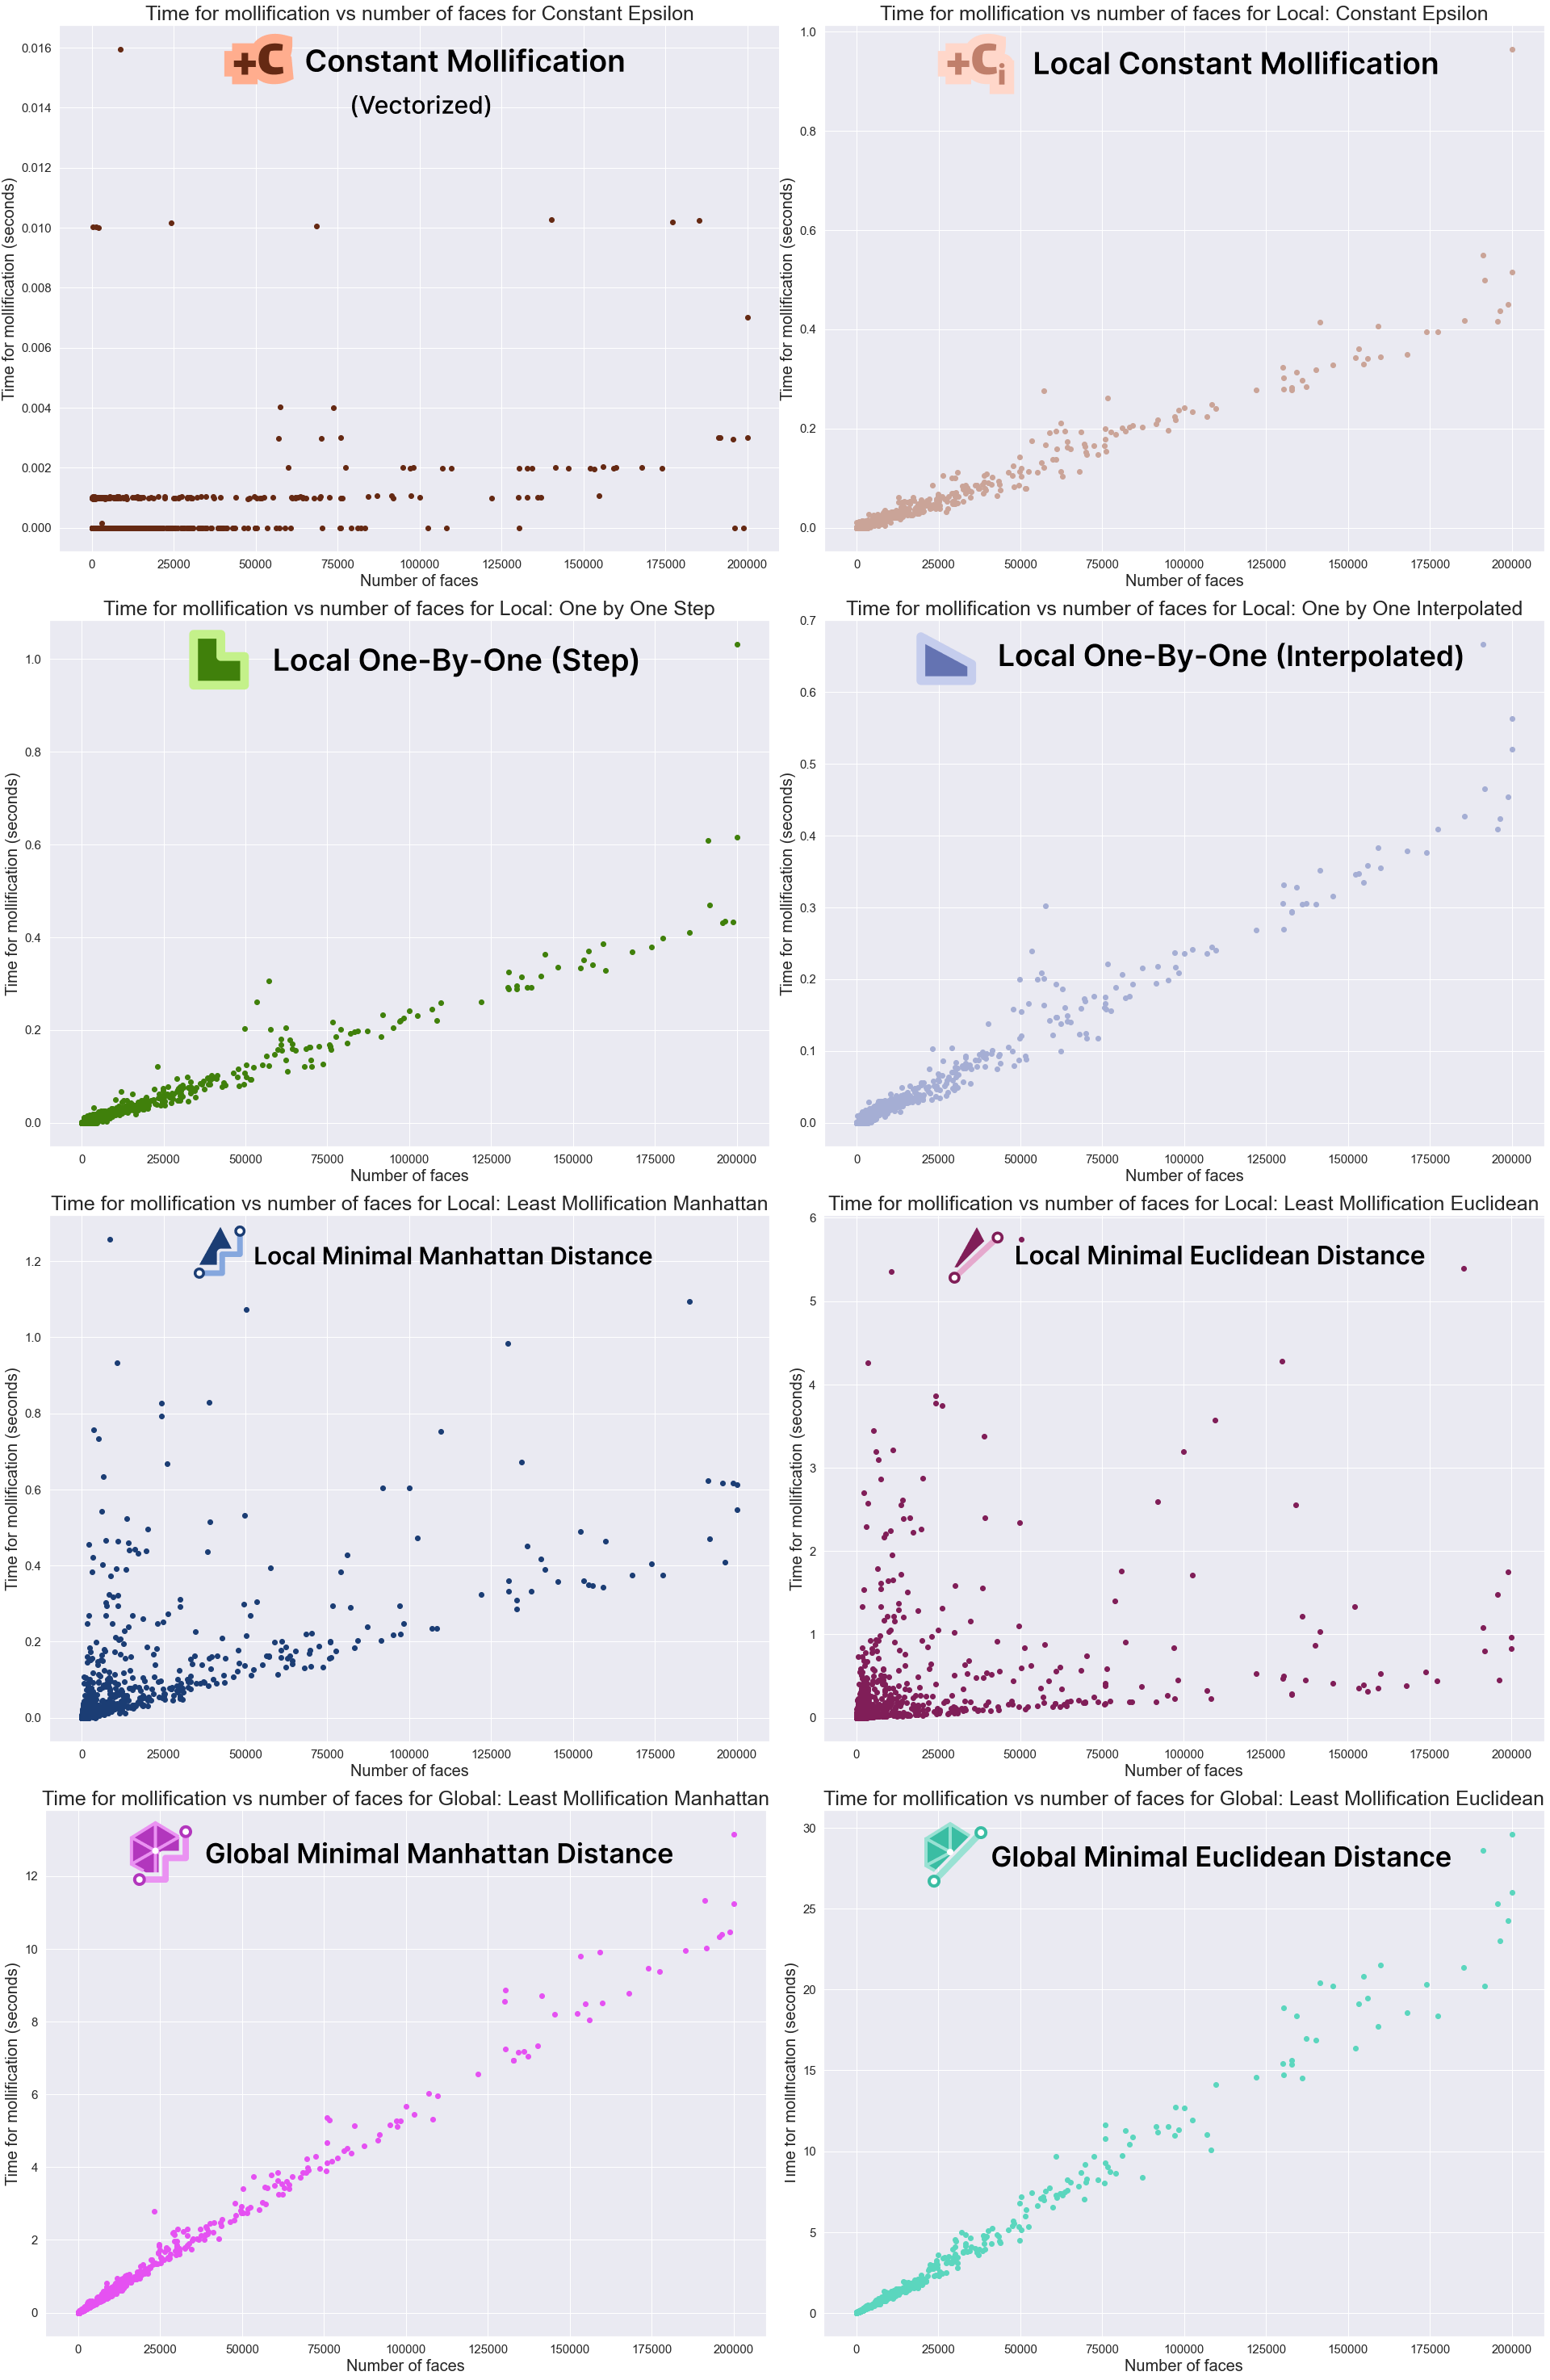
Fig. 19. For each scheme, the graph shows how the mollification running times increase in relation to the number of faces of the mesh.

The graphs above show that the Mollification schemes have a linear running time in relation face counts. Indeed, this is obvious for the local schemes as each face is processed independently. The local minimal distance schemes uniquely have very high variance, it is not as clear why this happens, though. For the vectorized implementation of the constant scheme, the running time is too small to be able to draw a pattern. Finally, although the global schemes also have linear growth, they are too slow in comparison. For example, a mesh with about 200,000 faces would take about 10 seconds for the Manhattan version and 25 for the Euclidean distance version on average. It is not clear how much performance gain we would get from a more optimized implementation with more efficient libraries.

5.4 Mollification + Simple Applications
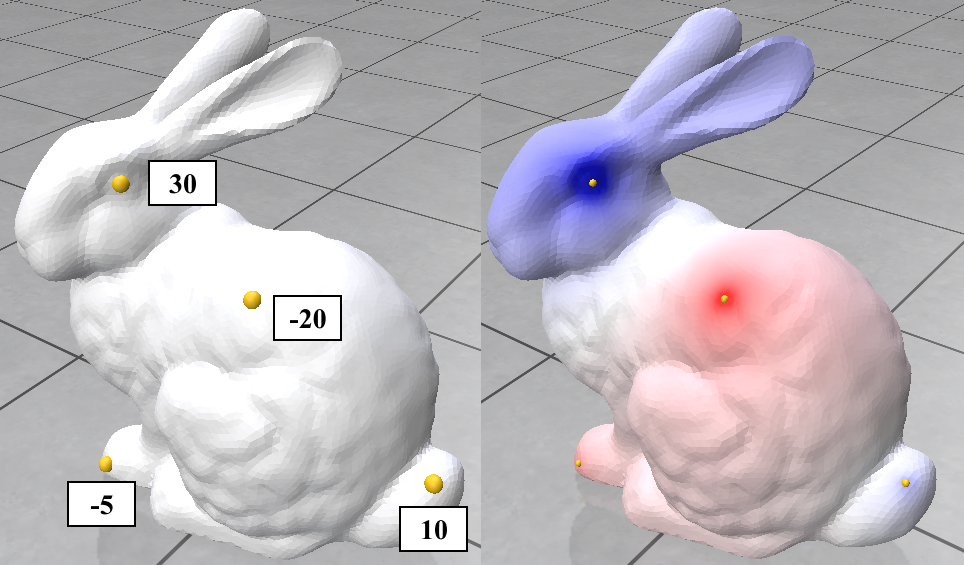
Fig. 20. Solving the Poisson equation on a density function over mesh vertices.
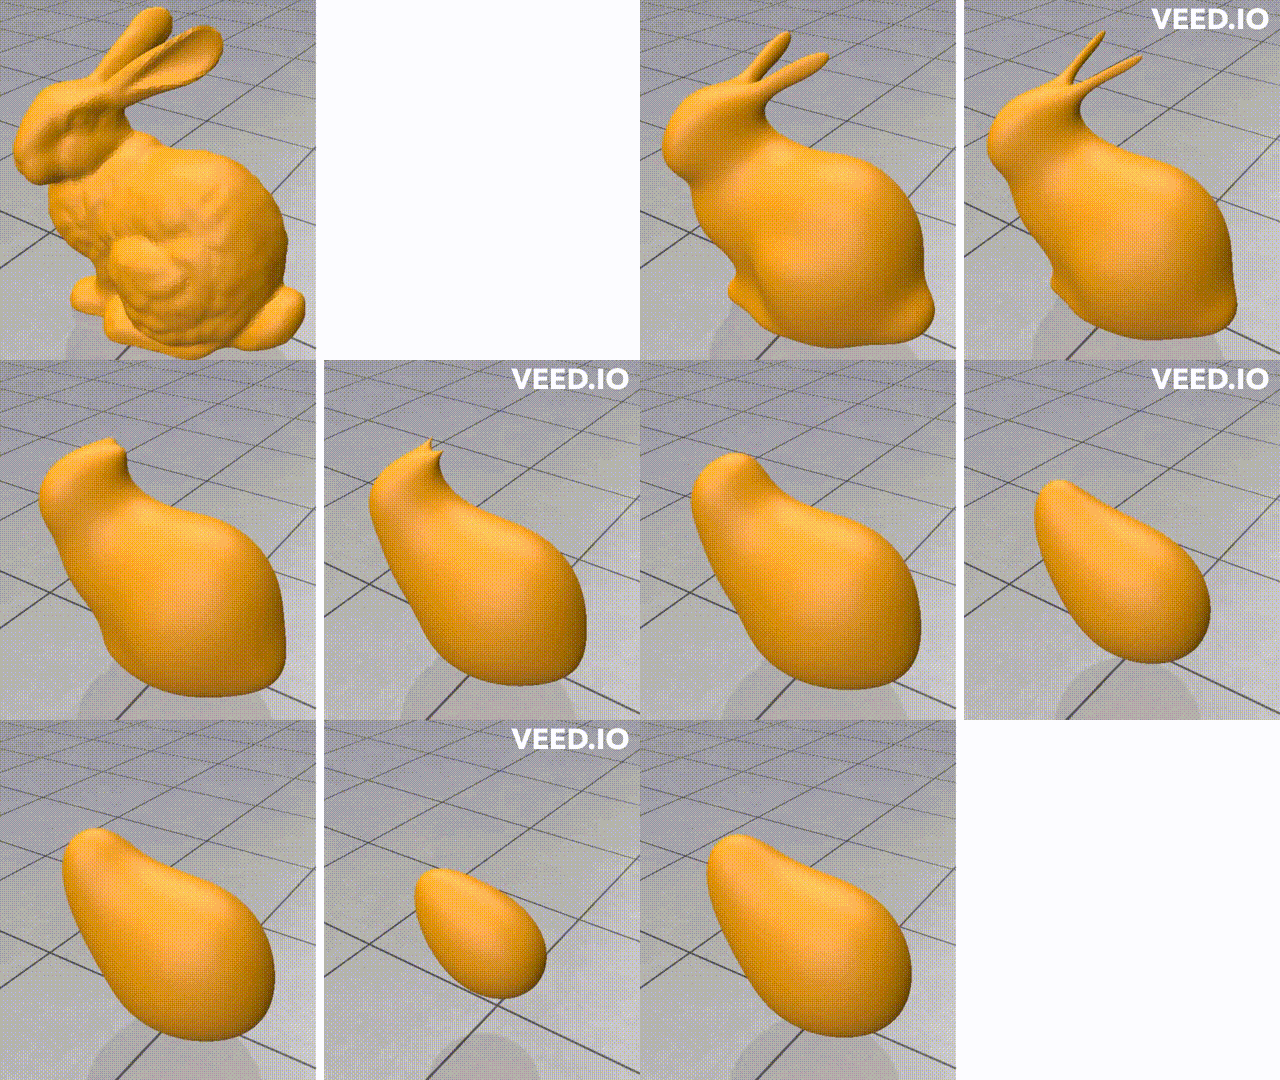
Fig. 21. An animation showing the mean curvature flow over the bunny mesh with different time step values.

Here we try 2 simple algorithms that use the Cotan Laplacian and the Mass matrix. The first is solving a simple Poisson equation that finds a smooth density function over the mesh vertices given some fixed density values on a few of them. The other one is the “(Modified) Mean Curvature Flow” [11]. This flow is used for Mesh Smoothing. the Figures above show these algorithms’ output on the stanford bunny mesh.
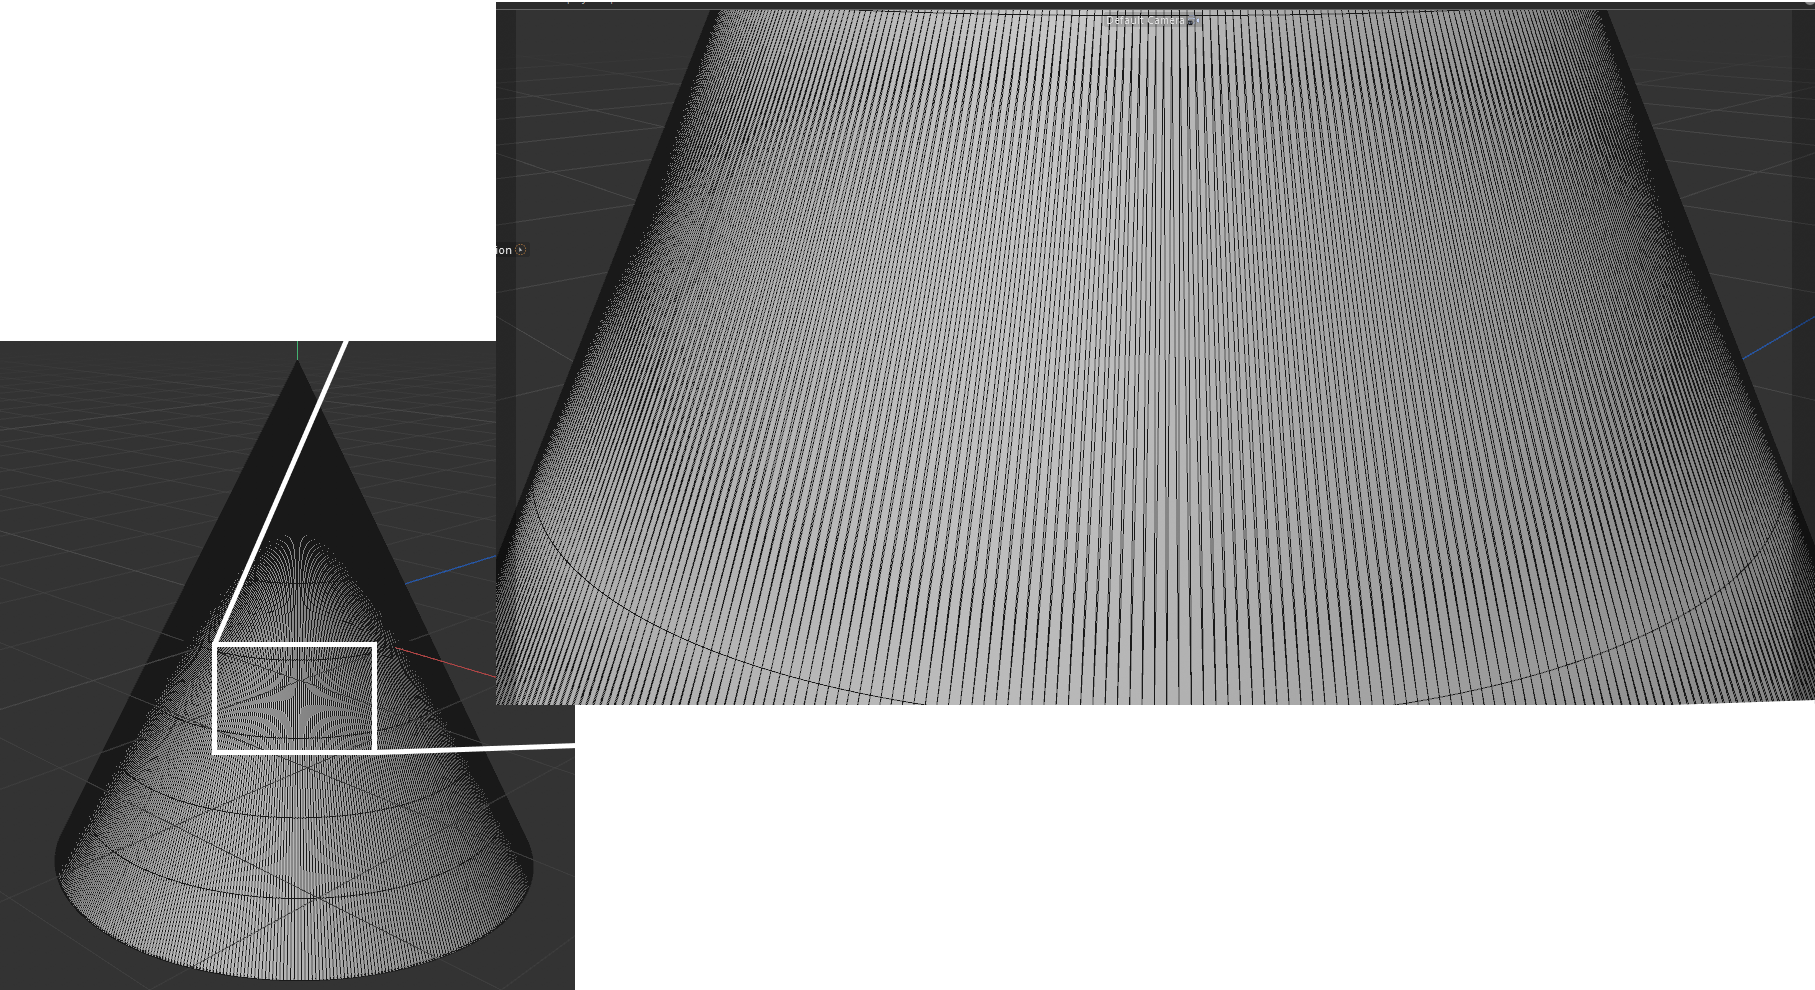
Fig. 22. A simple cone with an extremely skinny triangulation to test the effects of Mollification.

For purposes of quickly testing some applications with and without mollification, we generated a simple cone mesh segmented as, Rotation segments = 500, Height segments = 8, Cap segments = 8 (Shown above). Even though this is a mesh with simple shape and connectivity, it has a lot of skinny triangles. Without Mollification, running both algorithms on this mesh results in NaN values over the whole mesh. But with the slightest bit of Mollification (extremely small \(\delta\) values like \(10^{-10}\)), the algorithms don’t crash and we can see reasonable results as shown below.
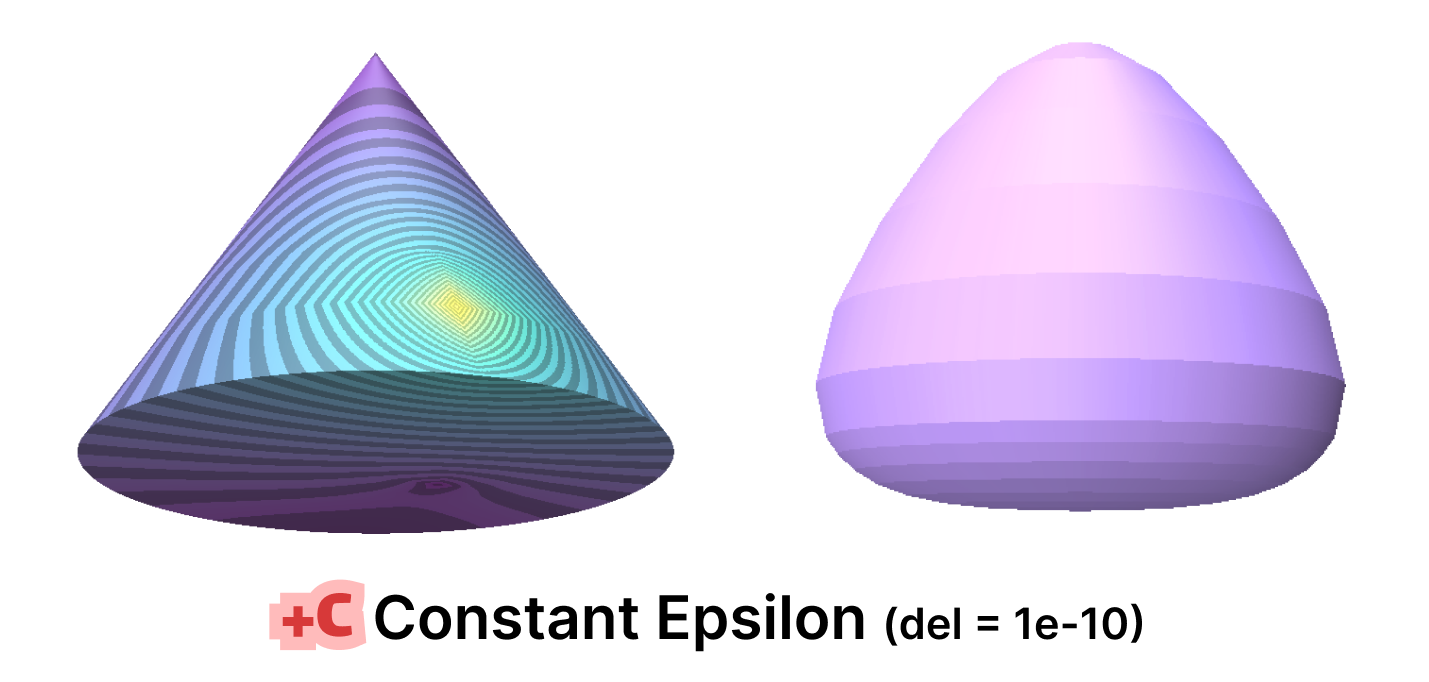
Fig. 23. The simple Constant Mollification with small $\delta$ is good enough for solving the NaNs issues that occur without Mollification.

It is worth noting that some combinations of the hacks earlier also produced similar results, some produced NaNs and others produced some results that are much less accurate. In general, it is not always clear which combination makes sense for the problem at hand.

5.5 Surface Parameterization
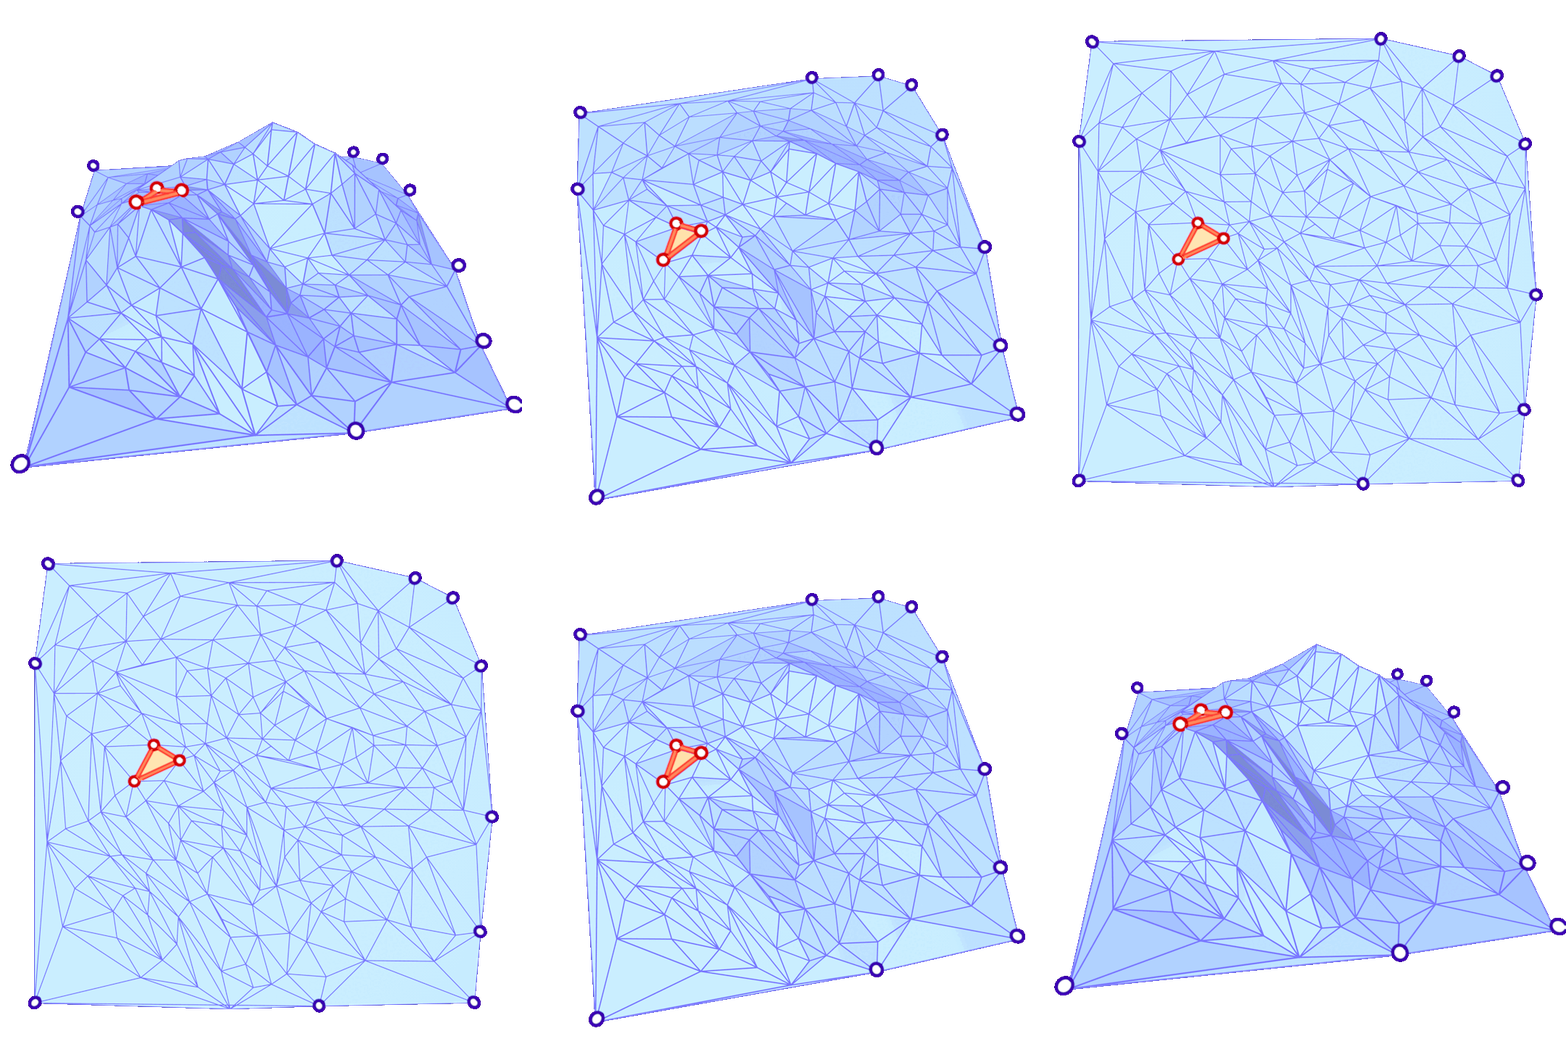
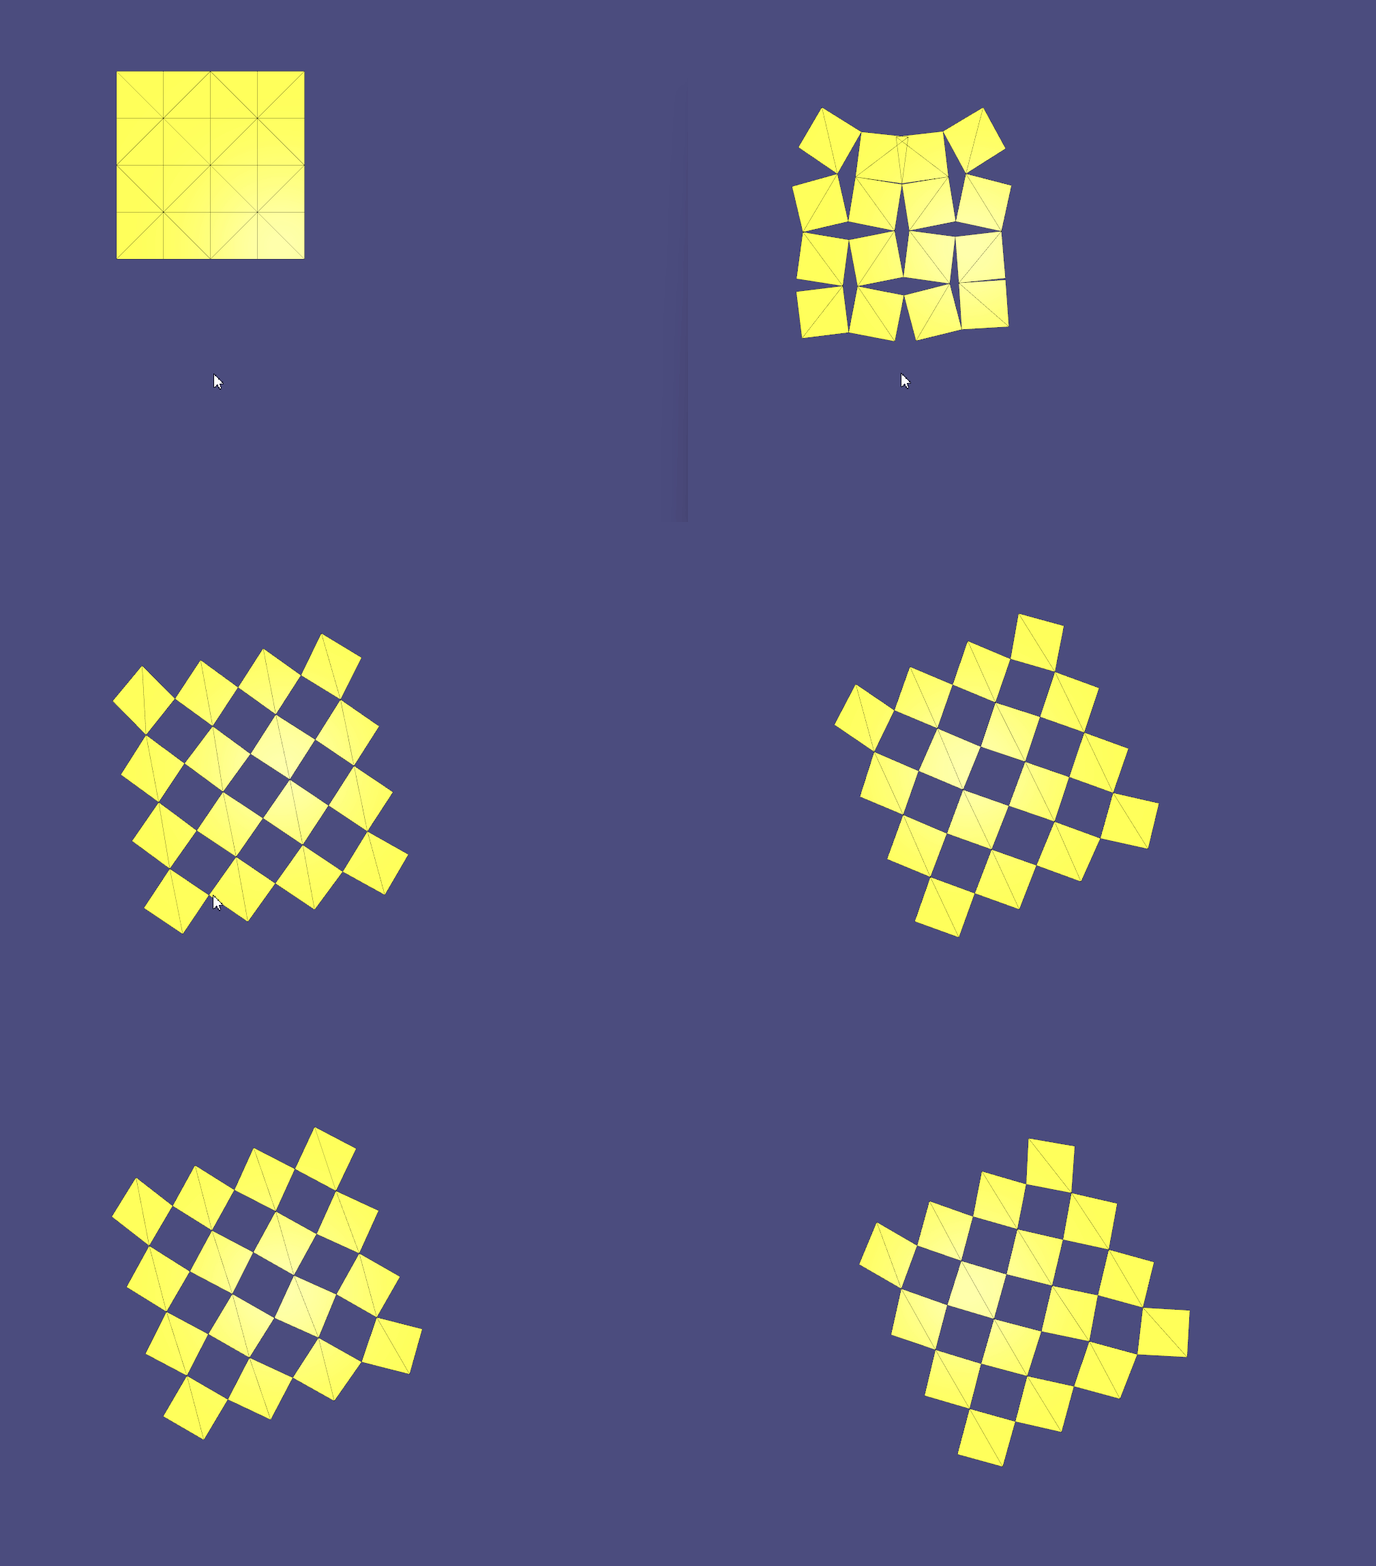
Fig. 24. A simple animation showing the 3D model of a Mountain being flattened to the UV plane. The red triangle is highlighted just to show how one triangle sits in the flattened mesh.
5.5.1 The Parameterization Problem

As defined by “Least squares conformal maps for automatic texture atlas generation” [12], the problem of parameterizing a surface \(S \subset \mathbb{R}^3\) is defined as finding a correspondence between \(S\) and a subset \(S’ \subset \mathbb{R}^2\) by unfolding \(S\). The animation above visualizes this “unfolding”. When the map \(f: S \to S’\) locally preserves the angles, the map is said to be conformal.

5.5.2 Relevant Parameterization Algorithms

In order to preserve angles between \(S\) and \(f(S)\), it is possible to minimize the variation of tangent vectors from \(S\). From [12], we can define an energy \(E_{LSCM}\) based on vector variation and the variance prediction method of Least Squares, the energy of Least Squares Conformal Map as follows:

\(E_{LSCM}(\textbf{u}, \textbf{v}) = \int_X \frac{1}{2} | \nabla \textbf{u}^\perp – \nabla \textbf{v} |^2 dA \)

As discussed by “Spectral Conformal Parameterization” [13], the previous equation can be written in matrix form. Let \(L_c\) denote the cotangent Laplacian matrix and \(\textbf{u}, \textbf{v}\) be vectors so that \([\textbf{u}, \textbf{v}]^T A [\textbf{u}, \textbf{v}]\) is the area vector of the mesh, we have the LSCM energy as:

\( E_{LSCM}(\textbf{u}, \textbf{v}) = \frac{1}{2} [\textbf{u}, \textbf{v}]^T (L_c – 2A) [\textbf{u}, \textbf{v}]\)

Fig. 25. To minimize this energy non-trivially, we can find the second smallest eignevalue (left) [SCP], or pin down 2 vertices (right) [LSCM].

Hence, in order to minimize this energy, the gradient must be zero, that is, \(Ax = 0\). However, since trivial solutions can be found in this optimization, two methods are used: pinning vertices and principal eigenvector of the energy matrix.

The idea of pinning two vertices is that one vertex will determine the global translation, while the other will determine the scaling and rotation, avoiding zeros in the Least Squares method. The other approach is to find the two smallest eigenvalues and eigenvectors of the energy matrix. Since a trivial solution is possible, the smallest eigenvalue is zero, then the second smallest eigenvalue and corresponding eigenvector will produce the minimization in question. The latter is a method called Spectral Conformal Parameterization (SCP). Both are shown in Figure. 25 above.

Fig. 26. Solving \(\delta u = 0\) on the interior vertex positions results in a minimal surface subject to the boundary conditions.

We also consider Harmonic Parameterization. This method is based on the idea of solving the Laplace equation on the surface \(S\) with Dirichlet boundary conditions. That is, given a surface \(S\) with all boundary vertices pinned, the Laplace equation \(\delta z = 0\) is solved on the interior of \(S\). Solving this equation results in a minimal surface as shown above.

Now, if we pin the boundary vertices to a closed curve in the plane, the resulting minimal surface would also be planar and the solution is the parameterization. In fact, since all boundary vertices are pinned, minimizing the harmonic energy is equivalent to minimizing the conformal energy mentioned above as the signed area term is constant for all possible parameterizations of \(S\).

In all of our experiments, we pin the boundary vertices on a circle. The relative distances between consecutive boundary vertices are preserved in the parameterization. A Harmonic Parameterization of the same mount model is shown below side-by-side with LSCM and SCP.
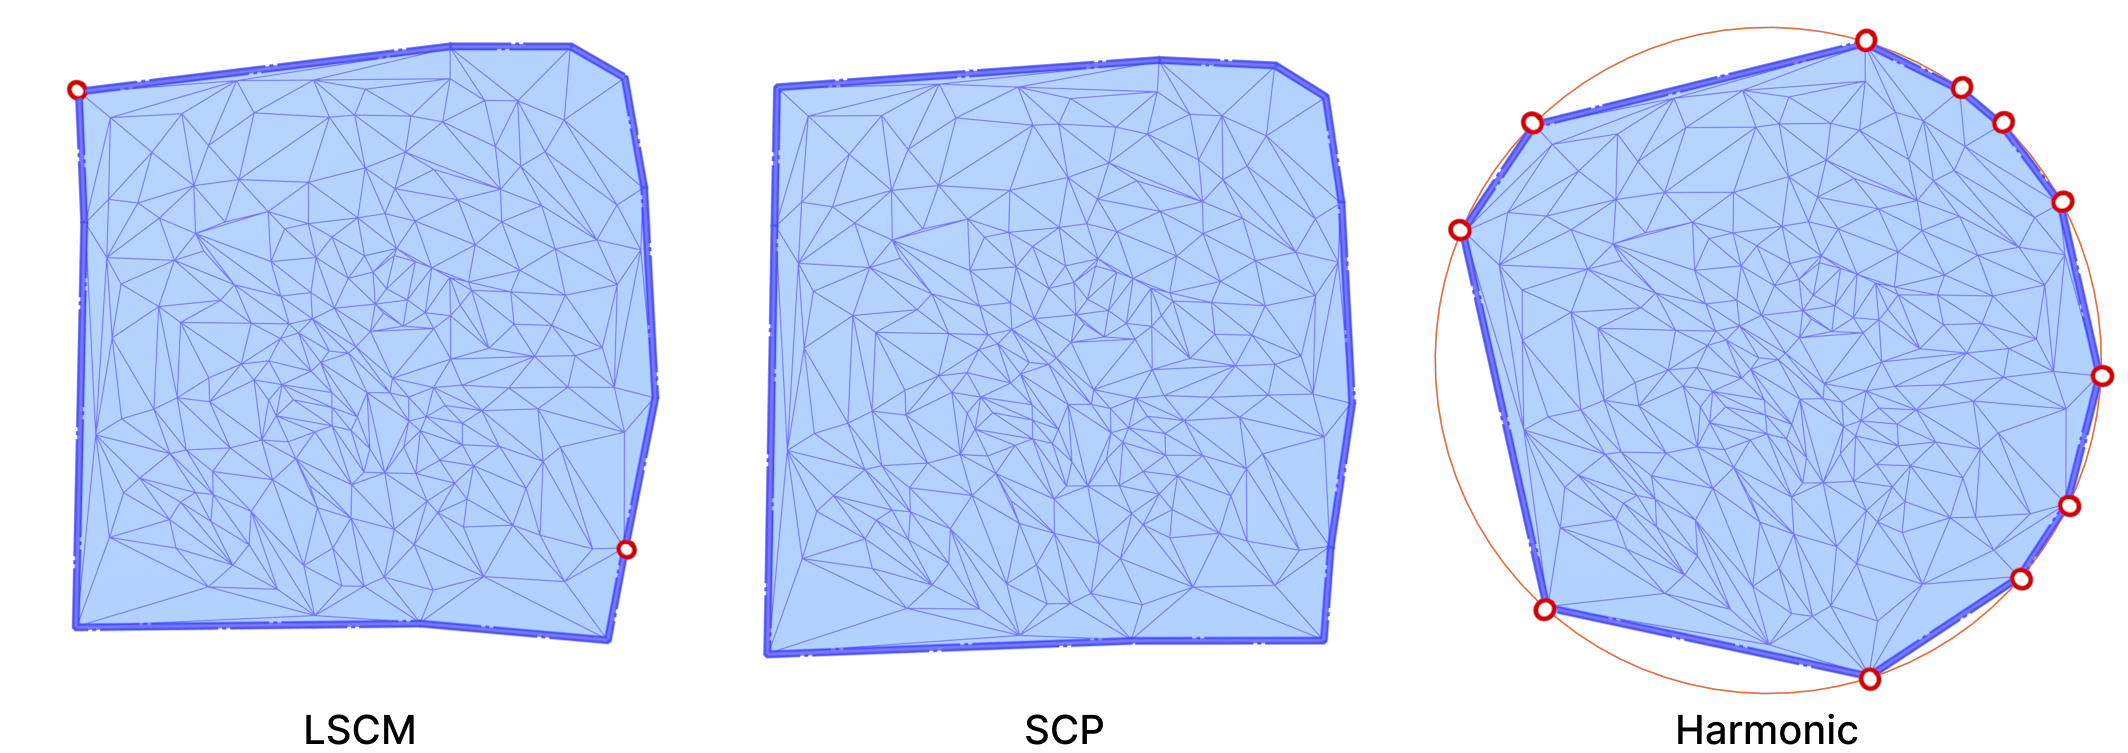
Fig. 27. The output of applying the 3 parameterization algorithms on the 3D mount model side-by-side. The pinned-down vertices are colored in red. Both SCP and LSCM are similar to each other because they are both conformal maps.

All three algorithms use the cotangent Laplace matrix in their energy minimization process. Computing this matrix involves edge lengths and triangle areas. Therefore, they are good candidates for testing the effects of mollification when applied to bad meshes.

5.5.3 Evaluation Metrics & Methodology

In order to produce a technical comparison between the alternative hacks defined in Section 5.2 and Intrinsic Mollification, adequate measures are necessary. For this, we measure Quasi-conformal Distortion. This error metric (visualized below) is a measure of angle distortion for a given mapping and it is usually used to measure the quality of a Conformal Parameterization.

Fig. 28. The Quasi Conformal error on the parameterized faces resulting from the 3 different algorithms. The Harmonic mapping clearly has greater qc error values since it is not Conformal.

A best-case transformation is a triangle similarity. That is, shearing should be avoided to abstain the parameterization from distortion. For this, the Quasi-Conformal (QC) Error measures how close the original and final triangles are to a similarity. An error of \(QC=1\) means that no shear happened. This can be used for comparing the distortion between the alternative strategies and the mollification.

For harmonic parameterization, we measure the relative area and length distortion instead of the QC error metric. This is because harmonic parameterization is not Conformal. Specifically, for one mesh, we compute this error as the norm of the vector of the (L1) normalized area (or length) differences before and after parameterization. In other words:

\(e_{A} = | \frac{A_{param}}{|A_{param}|_1} – \frac{A_{o}}{|A_{o}|_1} |\),

\(e_{L} = | \frac{L_{param}}{|L_{param}|_1} – \frac{L_{o}}{|L_{o}|_1} |\)

Here, \(A_{param}\) is a vector of face areas after parameterization (and potentially mollification), and \(A_{o}\) is the same but of the original mesh. We normalize each before taking the difference to make sure the total area is equal. The norm of this difference vector is the metric we compute to see how areas are distorted. We also compute an isometry error metric which is computed in the same way but over lengths instead of areas.

Whenever the Laplacian has weights that are either negative or numerical zeros, it is common for a parameterization to produce flipped triangles. That is, a triangle which intersects other faces of the parameterized mesh. Then, a possible measure is to count the number of flipped triangles in the parameterized form. We tried this on a few meshes (but not across the dataset) to see how much mollification improves things and we found some promising results. It is worth trying this on a large-scale dataset to get more specific statistics in the future.

Fig. 29. A simple animation illustrating growing a patch from a sphere to apply the parameterization algorithms on it.

Parameterization requires the input mesh to have at least a boundary loop. It also zero genus (i.e. topologically equivalent to a sphere). Since most Thing10k meshes are solid objects with arbitrary genera, we implemented a simple algorithm to extract a genus-zero patch from the input mesh.

The algorithm is a simple Breadth-First-Search starting from a random face and visiting neighboring faces. This is equivalent to growing the patch by applying the \(Star\) and \(Closure\) operators (\(Closure \circ Star\)) repeatedly (as shown below). The algorithm stops when we reach a specified fraction of the total number of faces in the input mesh. Of course, this algorithm is not guaranteed to find a manifold genus-zero patch, but it is not costly to re-run it (with a bit smaller fraction and from a different face) until a valid patch is found. Most patches are found on the first or second try.
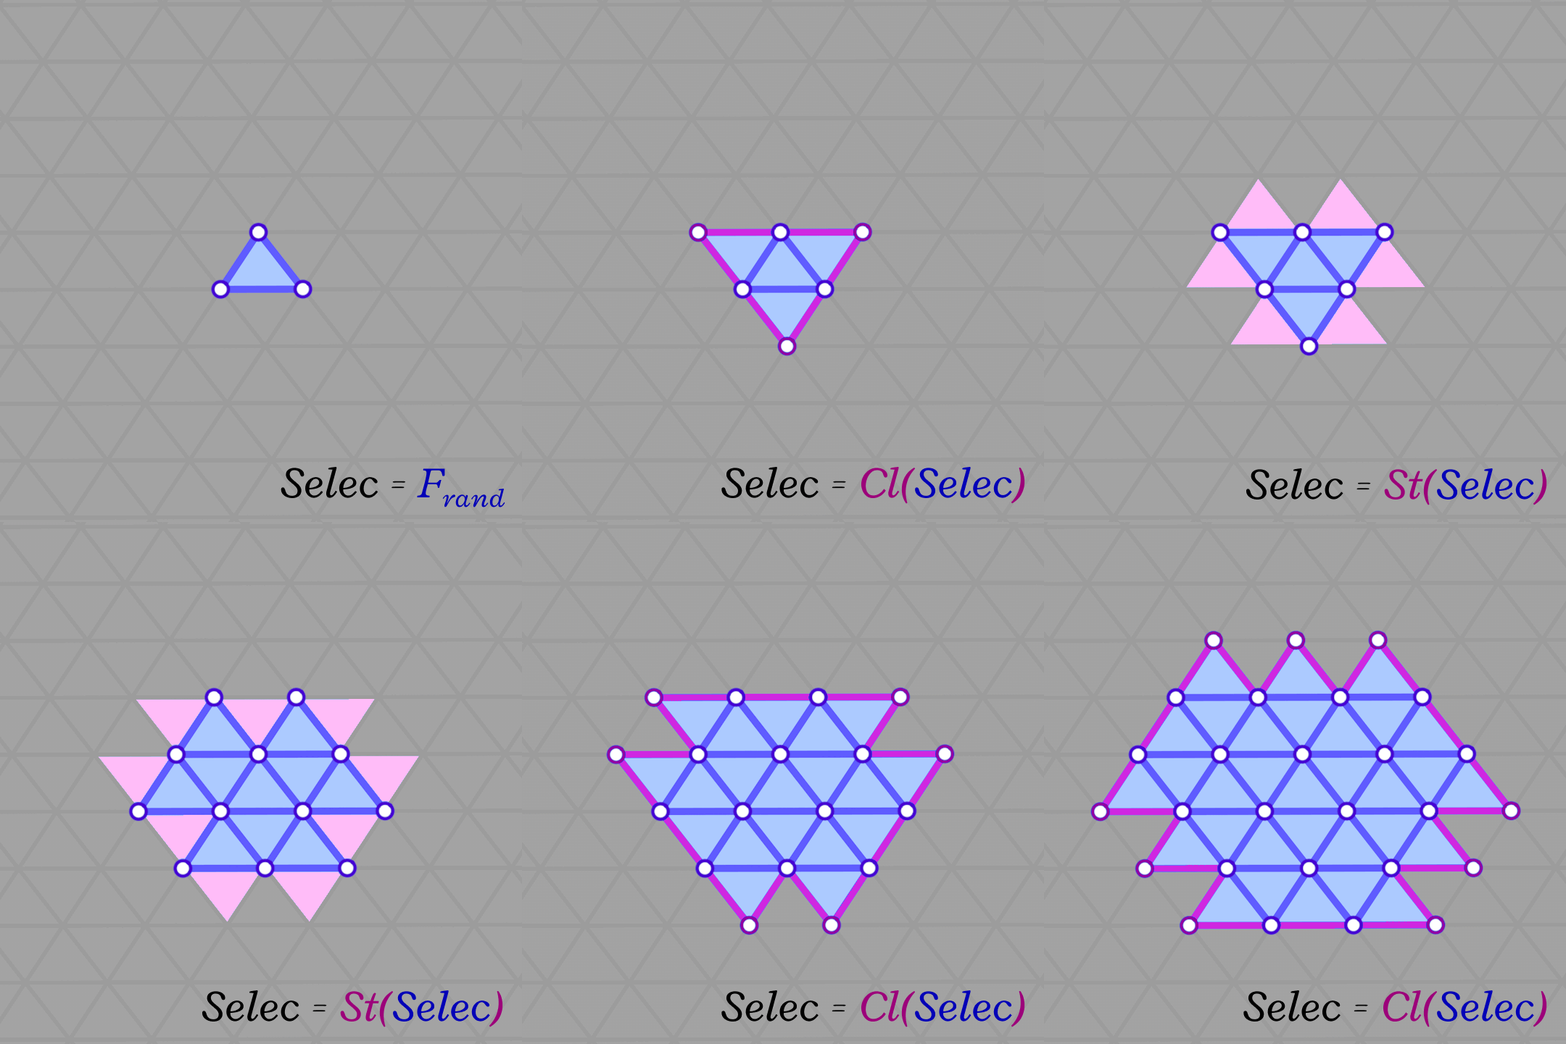
Fig. 30. Interleaving Star and Closure to grow the selection.
5.5.4 Benchmark Results

We ran the Conformal Mapping algorithms on the filtered Thingi10K dataset (~ 3400 meshes) and with with \(\delta\) values \(10^{-4}\) and \(10^{-2}\). We report the median of Quasi-Conformal (QC) errors across all meshes as well as the number of times this metric function returned NaN or Inf values (indicating degenerate parameterizations like zero-area). The table below summarizes such results
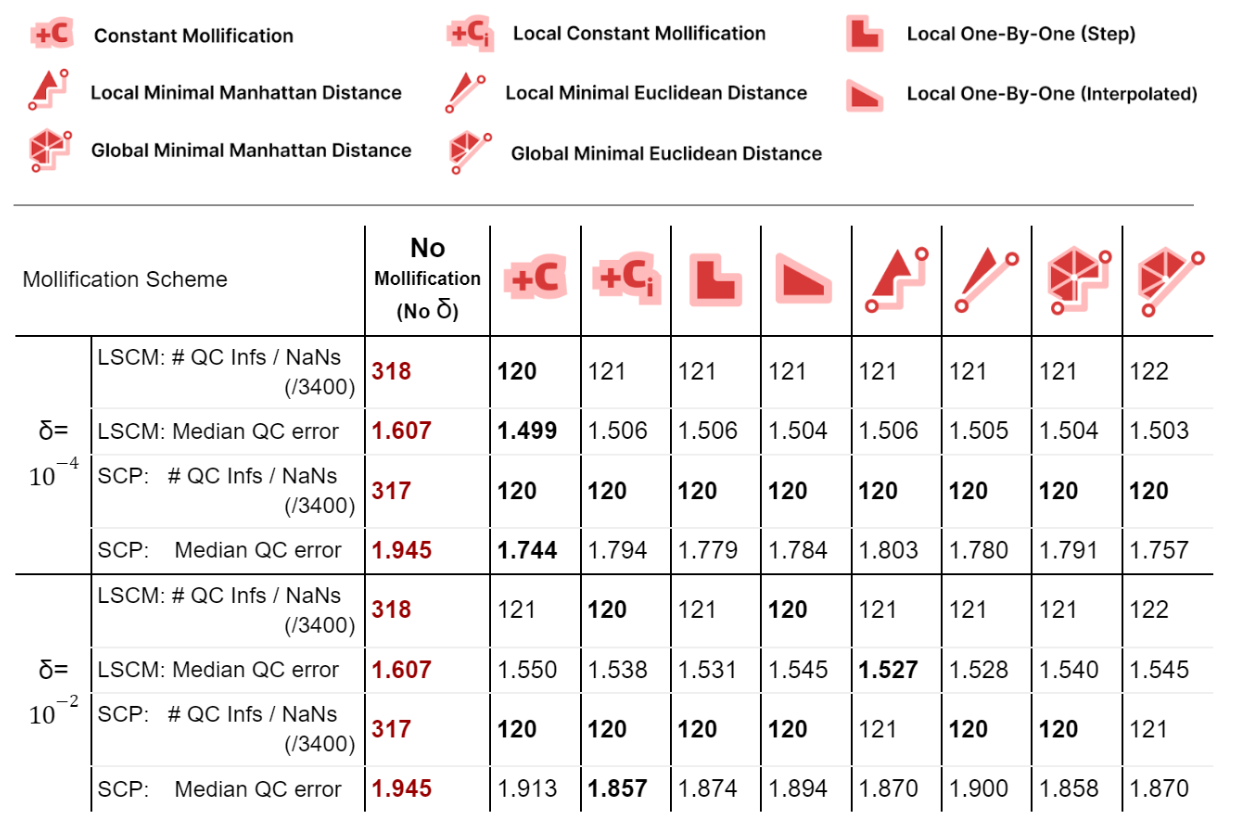
Table 3. showing the Conformal Mapping benchmark results over 3400 meshes.

We immediately see an improvement in robustness. For all schemes and both mapping algorithms, about 62% of the cases where QC = NaN (or inf) were solved by mollification. This is independent of the chosen \(\delta\) value. Of course, in some of these cases, it could be the case that our implementation of the QC error function is not robust enough (other than the mapping itself). But the effect of Mollification is clear nonetheless.

As for the QC error values, most schemes are generally close (and much better than no mollification), with the constant scheme being slightly better with smaller deltas and slightly worse with larger deltas. Overall, the more advanced schemes do not seem to make things better than the basic (constant) one for Conformal Parameterization. Here, it seems that smaller \(\delta\) values like \(10^{-4}\) seem to work better than larger values (\(10^{-2}\)).
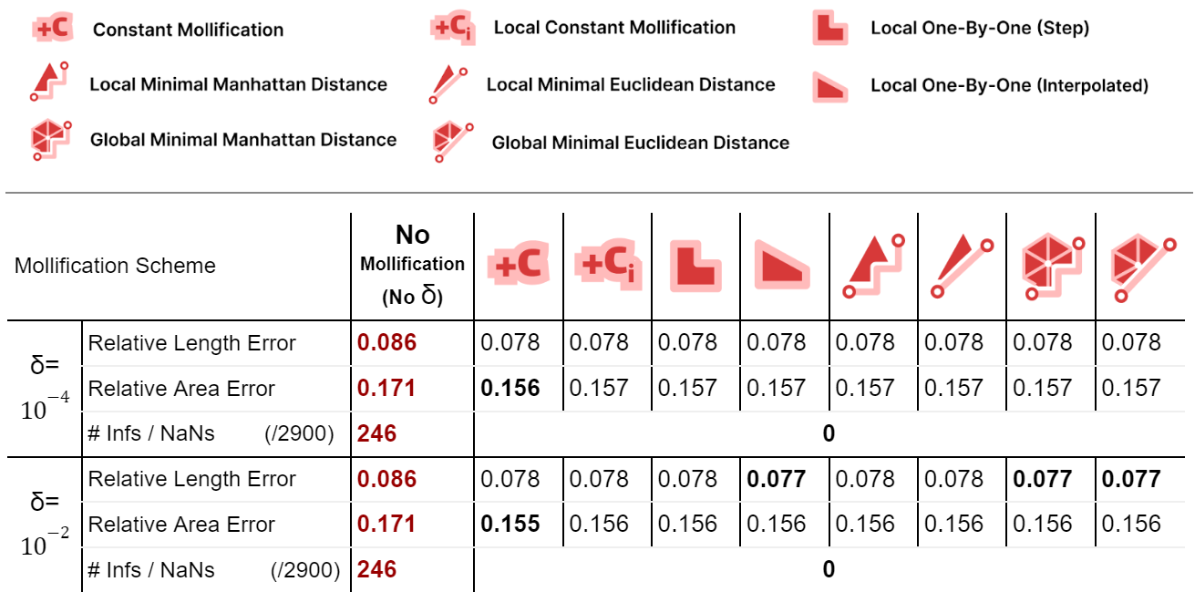
Table 4. showing the Harmonic Mapping benchmark results over 2900 meshes.

For harmonic mapping, all cases where the length error or area error where NaNs (or infinities) were solved by all schemes. As for the relative length and area errors, they seem to also improve significantly with mollification. And comparing the mollification schemes, they seem extremely close as well. Overall, ther isn’t a clear advantage of one scheme over the others.

We also ran benchmarks to compare these mollification schemes against the hacks. We first ran a small sample of the dataset on all combinations of the hacks mentioned in 5.2. There have been only two options that seemed to improve things significantly here. Namely, Replacing NaN/Infs with zeros or with ones. So, we ran the parameterization benchmarks again (on 3400 meshes) with these two options and without them, and compared that against 4 of the mollification schemes (\(\delta = 10^{-4}\)). The results are summarized in the table below.
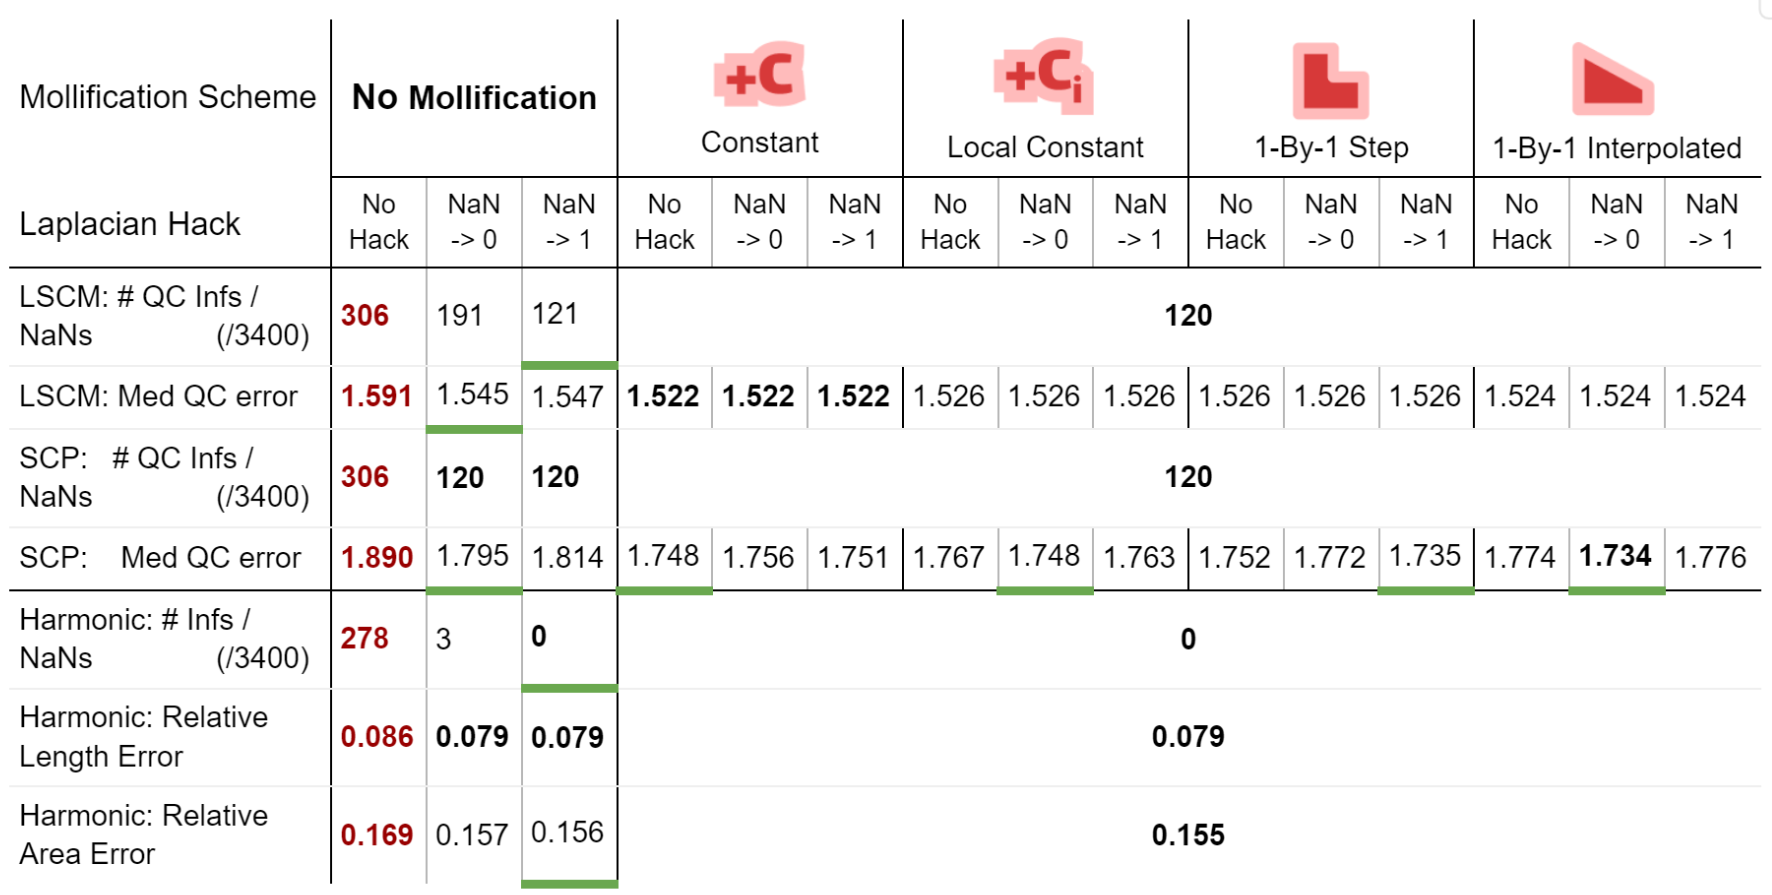
Table 5. Comparing simple hacks against Intrinsic Mollification schemes, and the combination of both. Best values per row are in bold. Cases where a hack is clearly better than the 2 other options (for the same mollification scheme) are underlined with a green line.

From the table, first, we see that the Nan-to-Zero hack isn’t reducing the cases of Qausi-Conformal error nearly as much as the Nan-to-One hack or the mollification schemes. Moreover, while both hacks reduce the Median of these errors, there is a clear advantage for all Mollifiction schemes. In fact, all of them reduce this metric by about \(~ 50-60\%\) more on average than the hacks. From this, it is clear that Intrinsic Mollification has stronger effects on robustness than even the best-performing combinations of the tested hacks.

Another surprising result from the table is that combining Intrinsic Mollification with such simple hacks can be useful in some cases. For example, on local schemes in the table, the hacks sometimes even further improve the effect of mollification on the QC error. This shows that we can still use hacks after Mollification but it is not immediately clear when to use which hack because they can also harm the results.

Overall, for the parameterization benchmarks, there does not seem to be a clear advantage of the introduced Mollification schemes to the original constant one.

5.6 Geodesic Distance

5.6.1 The Geodesic Distance Problem
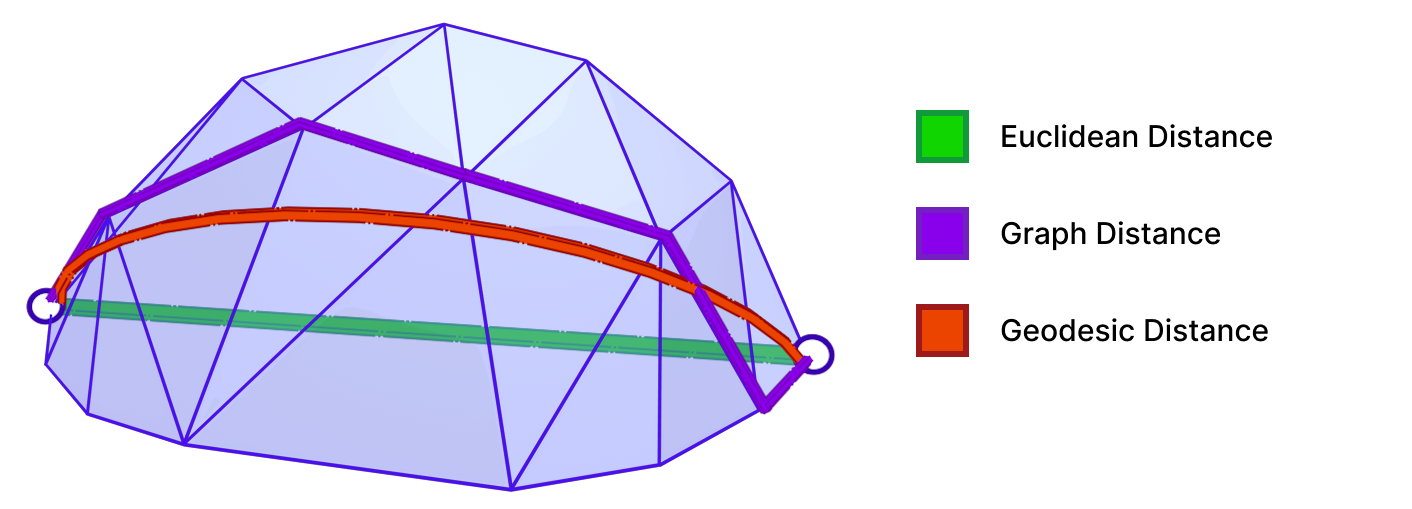
Fig. 31. A geodesic distance (red) between two points is the length of the shortest path between them on a curved surface (a Sphere patch in this example). This is different from the trivial Euclidean distance (green) and the graph distance (purple) that can be computed easily with algorithms like Dijkstra.

A Geodesic path represents the shortest (and straightest) path between two points on a surface. Geodesic distance is the length of such path. As shown above, the geodesic distance is different from the trivial Euclidean distance. Accurate computation of geodesic distance is important for many applications in Computer Graphics and Geometry Processing, including Surface Remeshing, Shape Matching, and Computational Architecture. For more details on geodesics and algorithms for computing them, we refer the reader to “A Survey of Algorithms for Geodesic Paths and Distances“[14].

5.6.2 The heat method for computing geodesic distance
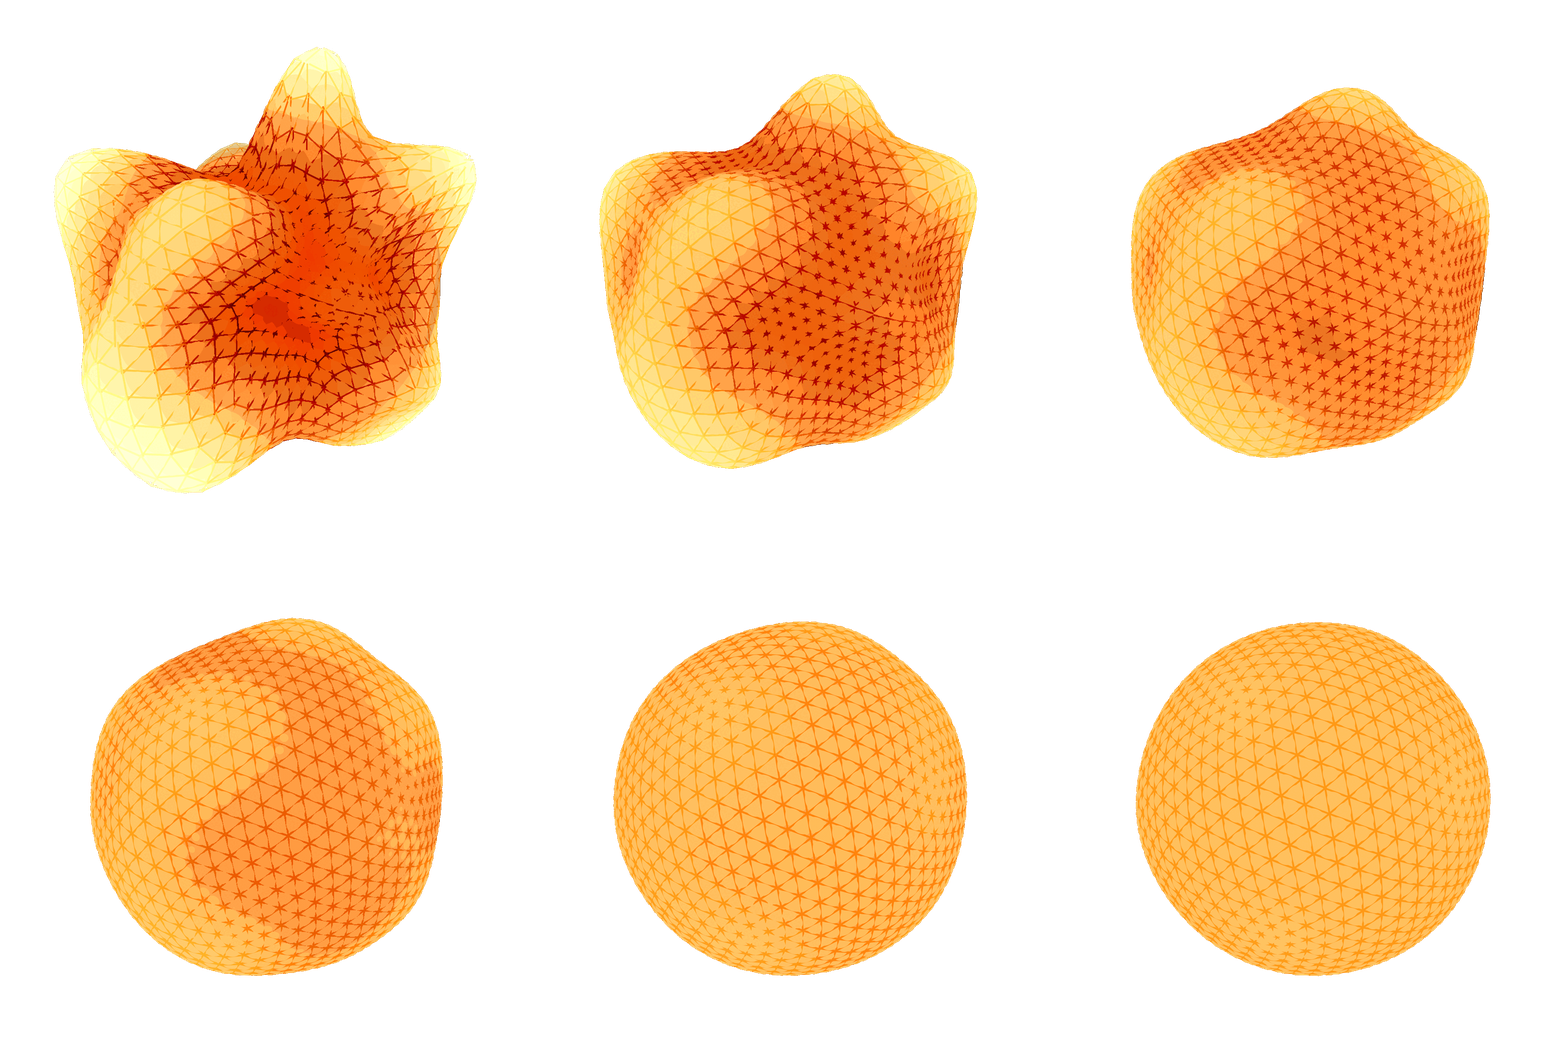
Fig. 32. An animation showing the heat diffusion process on a sphere. For visualization purposes, the points with high heat values (in bright yellow) are moved far outwards from the center and the points with low heat values (in red) are moved inwards.

The idea of the heat method is based on the concept of heat diffusion. That is, given a surface \(S\) with a heat distribution function \(u_0\), the heat diffusion process is described by the heat equation:

\(\frac{\partial u}{\partial t} = \Delta u\)

where \(\Delta\) is the Laplace-Beltrami operator. As time goes by, the heat distribution function \(u\) will approach the steady state solution \(u_\infty\) where \(\frac{\partial u_\infty}{\partial t} = 0\).
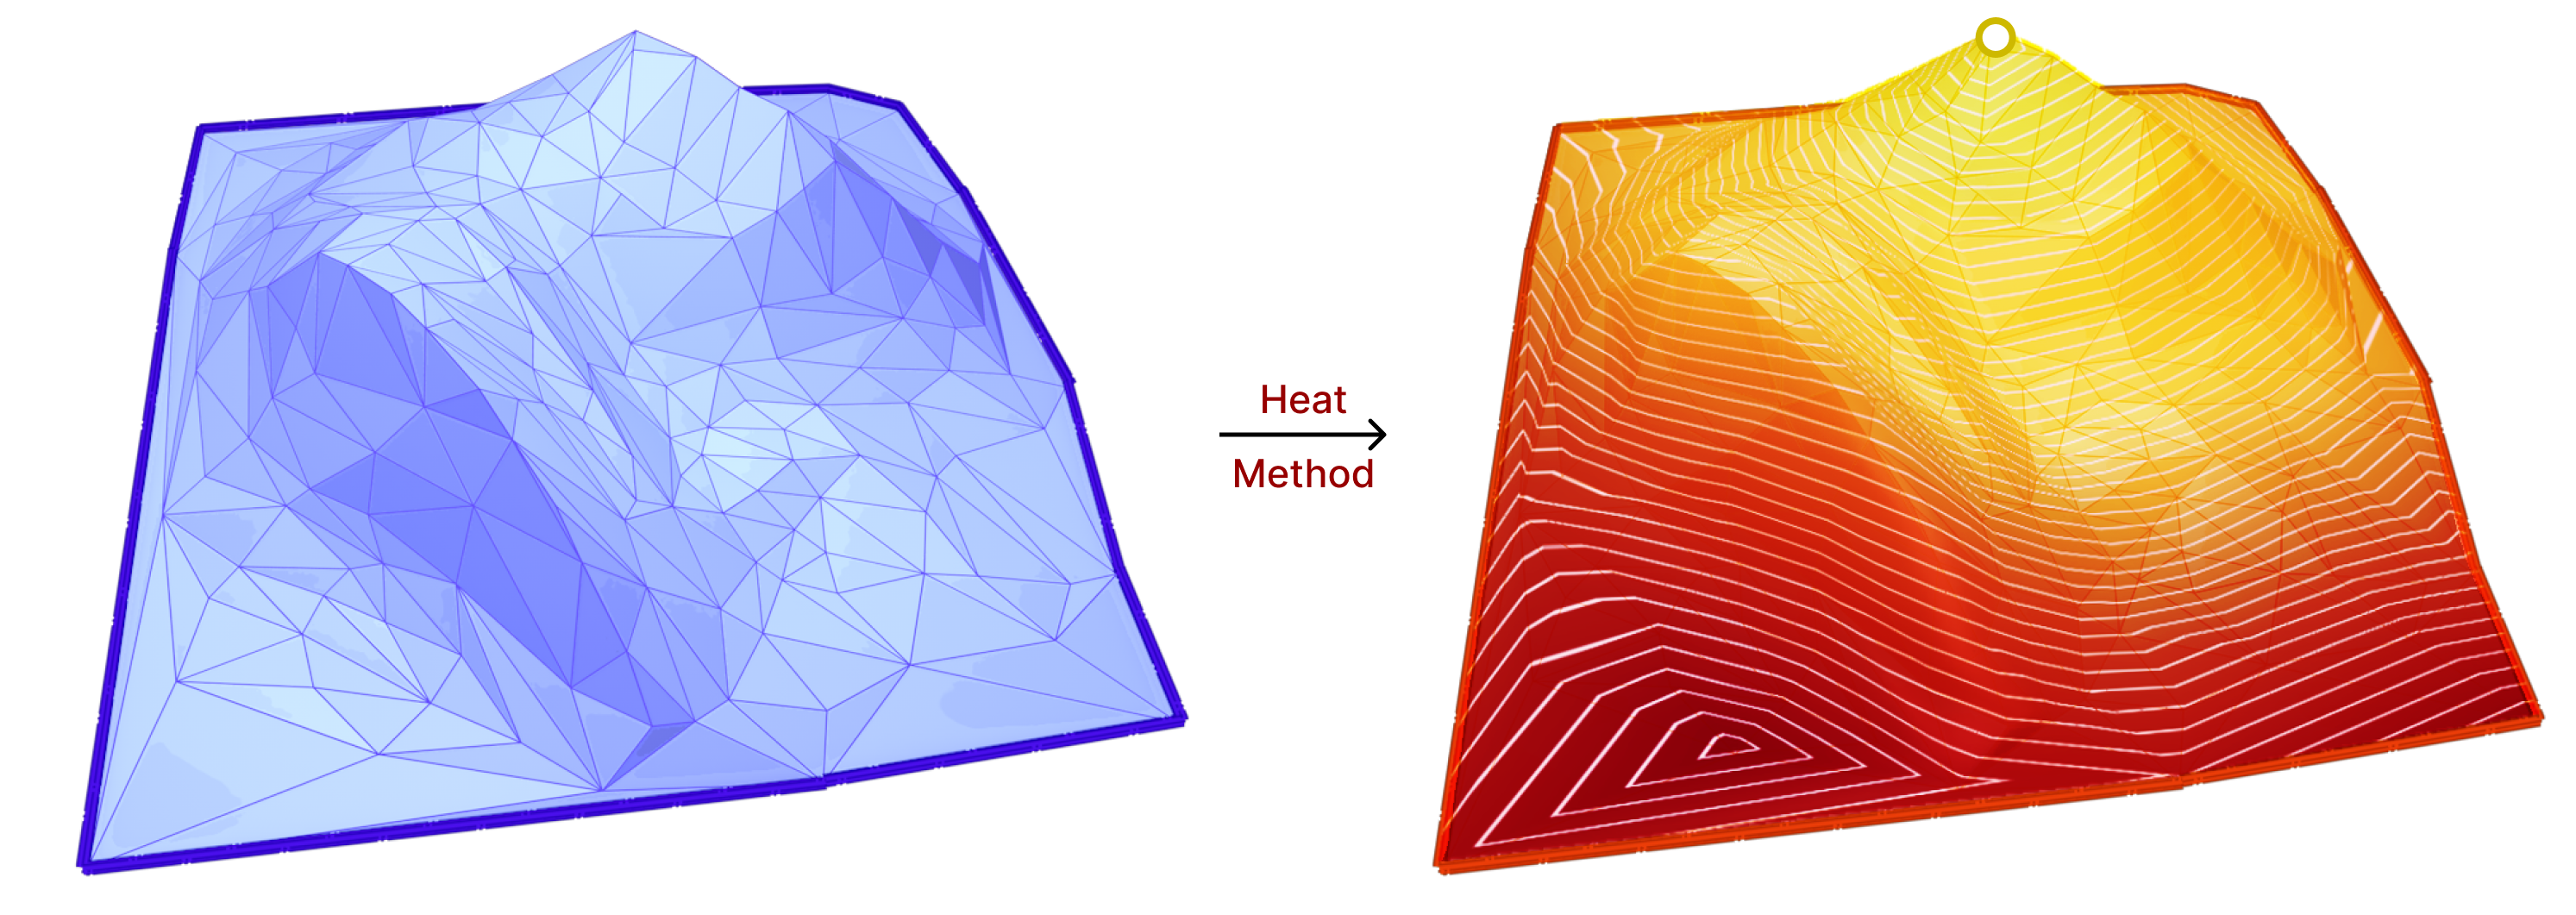
Fig. 33. Showing the result of applying the heat method on the 3D mountain model. The heat source is the vertex at the top of the mountain (marked in bright yellow).

The heat method uses the heat diffusion process for a short period of time to compute the geodesic distance function. More specifically, the heat method consists of the following steps:

  1. Initialize the heat distribution with heat source/s on surface vertices.
  2. Let the heat diffuse for a short period of time. This involves solving the heat equation: \(\frac{\partial u}{\partial t} = \Delta u\).
  3. Compute the gradient of the heat distribution function \(X = \nabla u\).
  4. Normalize the gradient \(X\).
  5. Finally, solve a simple Poisson equation to obtain the geodesic distance function \(\phi\).

\(\Delta \phi = \nabla \cdot X\)

From the above steps, we can see that the Laplace-Beltrami operator is used multiple times. Hence, this method is a good candidate to test the effects of our work on its accuracy. For more details on the heat method, we refer to “The Heat Method for Distance Computation“[15].

5.6.3 Evaluation Metrics
Fig. 34. The exact polyhedral distance algorithm finds geodesics by tracing over straight segments over triangle chains. The resulting geodesic curve is a straight line in the (isometrically) flattened view of the chain.

For evaluating the accuracy of the heat method, we use the exact polyhedral distance [16] function as a metric for comparison. The exact polyhedral distance metric provides the exact distance between two points on a polyhedral surface. Of course, the polyhedral mesh is an approximation of the original surface, so the exact polyhedral distance is not the same as the geodesic distance on the original surface. However, the exact polyhedral distance is a good enough approximation and it quickly gets closer to the geodesic distance of the original surface as the mesh resolution increases (quadratic convergence).

5.6.4 Benchmark Results

with the filtered Thingi10k meshes as a dataset, the exact polyhedral distance as a metric, the heat method was evaluated with mollification. We ran both of the algorithms with a random vertex as the source. We ran the benchmarks with different \(\delta\) values \(10^{-4}\) and \(10^{-2}\), scaled by the average edge length of the mesh. The results are summarized below:
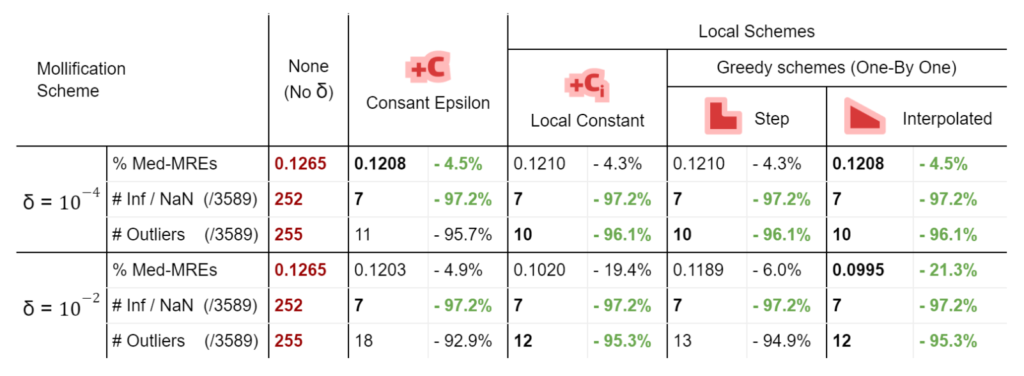
Table 6. The table summarizes the results of the heat method benchmark.

To measure accuracy, we computed the error as the Mean Relative Error (MRE) between the polyhedral distance and the heat method’s distance for each mesh. Since we are doing Single Source Geodesic Distance (SSGD), this is the mean of relative errors for all vertex distances from the source. We report the median of such MREs (Med-MREs) as a measure of how well each algorithm does on the whole filtered dataset (more than 3500 meshes).

There is an immediate improvement in accuracy using any Mollification algorithm in comparison to applying the heat method without any. In particular, for \(\delta = 10^{-4}\), we can see about \(~ 4.5\%\) of similar improvement for all schemes compared to no-mollification. This is true as well for smaller values like \(10^{-5}\) and \(10^{-6}\).

For large delta values (\(\delta = 10^{-2}\)), we can see that the local schemes produce significantly better results than the constant scheme (and no-mollification); Reaching an improvement of (~\(21.3\%\)) for the Median of MREs on the One-By-One Interpolated Scheme.

An important note is that we ran benchmarks multiple times with slightly different configurations. In some cases, the One-By-One Step scheme did better than the Local Constant One. But it was almost always the case that One-By-One Interpolated Scheme was a bit better than others for large \(\delta\).

In addition to MRE, we count the number of times the heat method produces infinity or NaN values (which is an indication of failure) as #inf | NaN. We also count the number of times where \(MRE > 100\%\). This is reported as #Outliers. It also includes in its count the times infinity or NaN values were produced.

Here is where Intrinsic Mollification truly shines; running the heat method implementation on the dataset directly results in about \(~ 252 / 3589\) failing cases (Infinities or NaNs). But, with the slightest mollification, 97% of these cases work fine. This is true for smaller values of \(\delta\) that aren’t shown in the table too (like \(10^{-6}\)). As for outliers, we notice that the Local Mollification algorithms tend to produce fewer outliers on average than the Constant Mollification scheme, especially when \(\delta\) is larger. The images below show some examples of the Outliers.
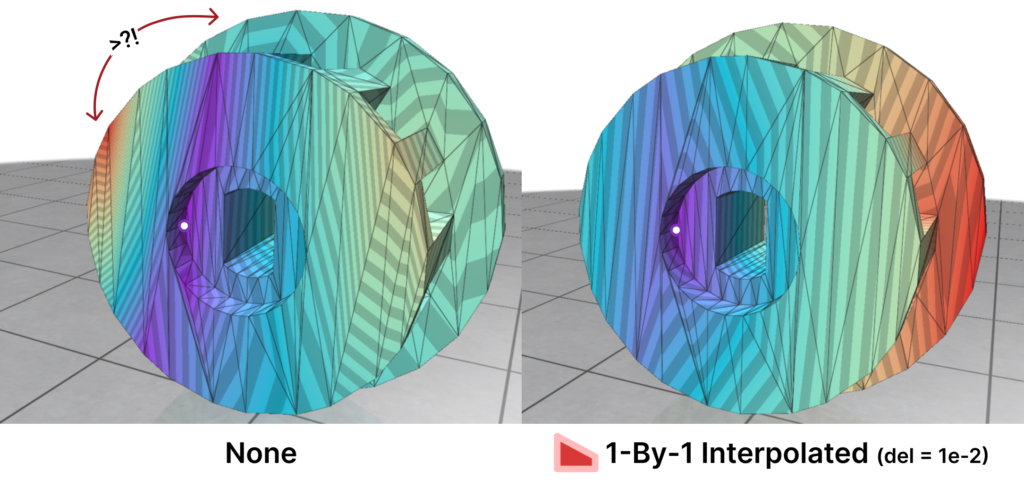
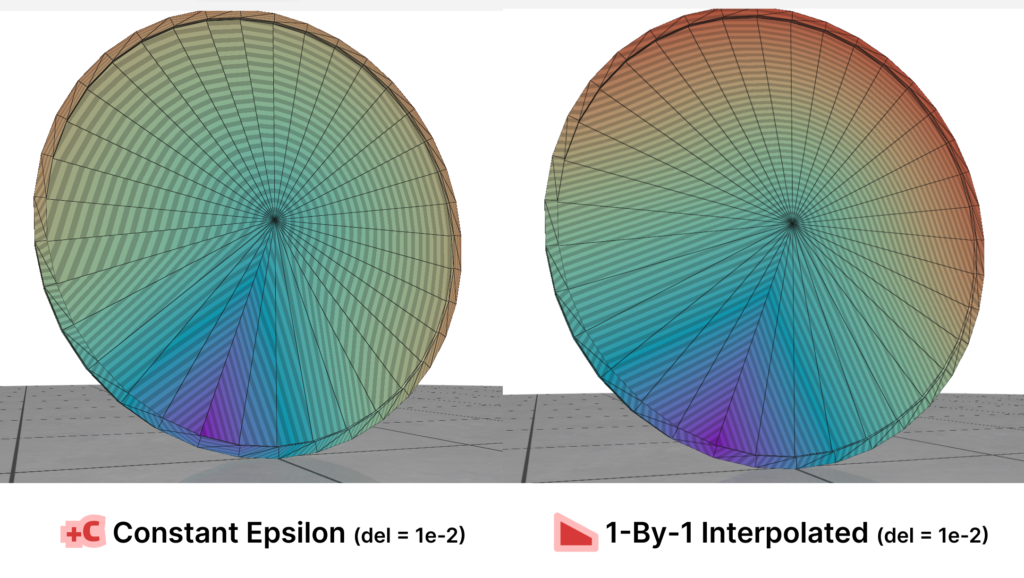
Fig. 35. Outliers.1: In some meshes, The results without mollification can be very wrong due to skinny triangles. Here distances are highly distorted some of the closest points having the largest distance as shown. With Mollification, these results look significantly better.
Fig. 36. Outliers.2: Here we can see that in some cases and even for reasonable meshes, the Constant scheme produces outliers. The resulting distance function looks discontinuous and the distances are distorted. But the Local schemes can produce much more reasonable results. This was also tried on smaller $\delta$ values and the results were similar.

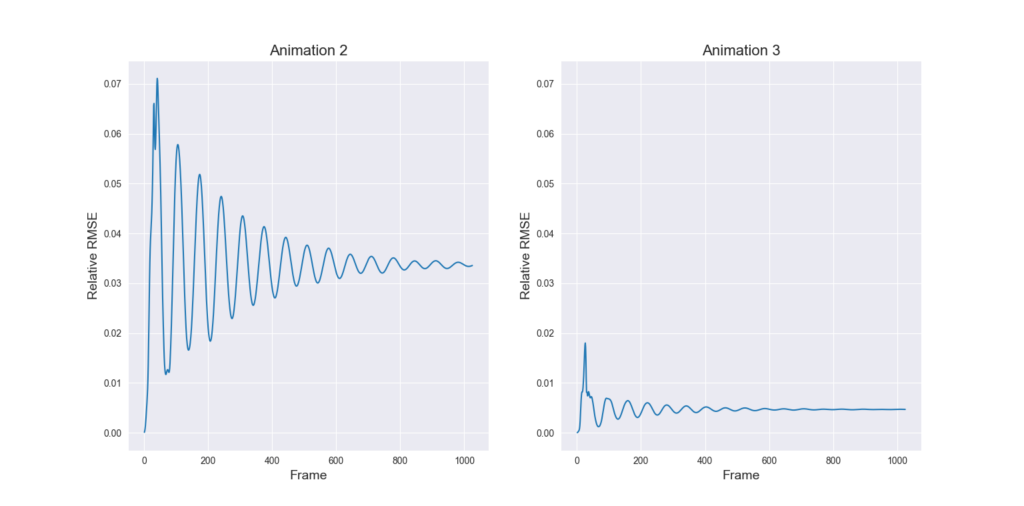
We ran this with and without the total length normalization step mentioned in 4.7. it had almost no effect on most of the mollification schemes. It is also interesting to see the behavior of each Mollification scheme with different $latex\delta$ values. Is there a best value for this parameter? The graph below shows this.

Fig. 37. The graph compares the effect of different \(\delta\) values on the mollification algorithms performance in terms of the median of Mean Relative errors on geodesics.

At least for the Heat method, one realization is that the local schemes allow higher \(\delta\) values than the constant scheme before the results get unreasonable. This is most likely because the local schemes mollify only where it is needed and with much less length distortion overall. Another realization is that \(10^-3\) and \(10^-2\) seem like optimal \(\delta\) values for the constant and local schemes respectively. We ran this benchmark a few different runs and with slightly different configurations but this fact seemed to hold for most runs.

As explained in the following section, we only ran this benchmark on the schemes shown in the table. It might be interesting to see how the others perform on the heat method. Also, we only ran these algorithms on meshes with atmost 20,000 faces to speed up the benchmark.

5.7 Notes on Implementation

we want to talk a bit about the benchmarks and the implementations of the heat method. we had trouble running/implementing it with Python and Libigl, so we switched to C++ and CGAL. We also had to rewrite the mollification algorithms in C++. Due to time constraints, we only managed to implement: the Constant, Local Constant, and Local 1-By-1 schemes. we think it would be interesting to try the other ones on the heat method and see their effects.

For the mollification schemes that use Linear or Quadratic programming, we used different solvers (SciPy and CvxOpt respectively). This makes the performance comparison between them questionable. Moreover, there might be other more time-efficient solvers. It would be interesting if that would increase the performance significantly.

6. Conclusions, Limitations, and Future Work

6.1 Conclusions
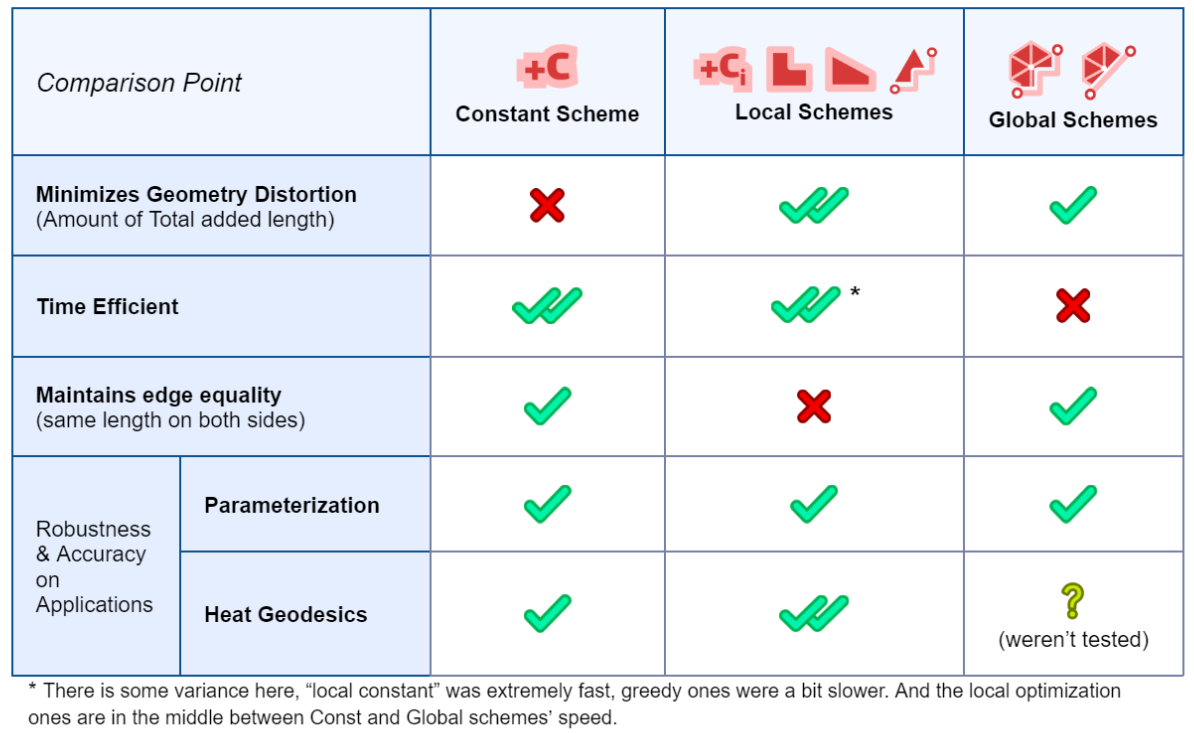
Table 7. Summarizing the comparison between the different mollification schemes.

Based on all benchmarks applied, it is clear that Intrinsic mollification can make algorithms using the Cotan-Laplace matrix much more robust, especially against extremely skinny triangles. Moreover, it seems that the simple “bad-value” replacement hacks are not as effective.

As for comparing the newly introduced Mollification schemes with the original one, They aim to reduce the amount of added length, and succeed remarkably at that, decreasing the distortion in geometry greatly. This is an important result; because some applications and algorithms might require harder guarantees on (intrinsic) triangle quality. Thus, a higher \(\delta\) value can be used to achieve that without distorting triangles that are already in good shape.

Some of the Introduced schemes are global and highly time-expensive. However, the local schemes are reasonably fast and reduce added length most effectively among all mollification schemes.

Running these on the parameterization algorithms, all these schemes do not make any improvements over the constant scheme. On the other hand, It is true that on some algorithms (like the heat method), the local schemes do improve things quite remarkably.

6.2 Limitations

Intrinsic Mollification is a good pre-processing step because it is very simple and fast. But this is also the reason it is very limited; In particular, there’s only so much improvement you can hope to get by just changing edge lengths. For instance, if you don’t have enough resolution in one part of the mesh (or you have too much resolution), mollification won’t help.

there is also a trade-off between (intrinsically) better triangles and distorting the geometry too much. A simple example is having a cone vertex with very high valence which would get very distorted as shown below.
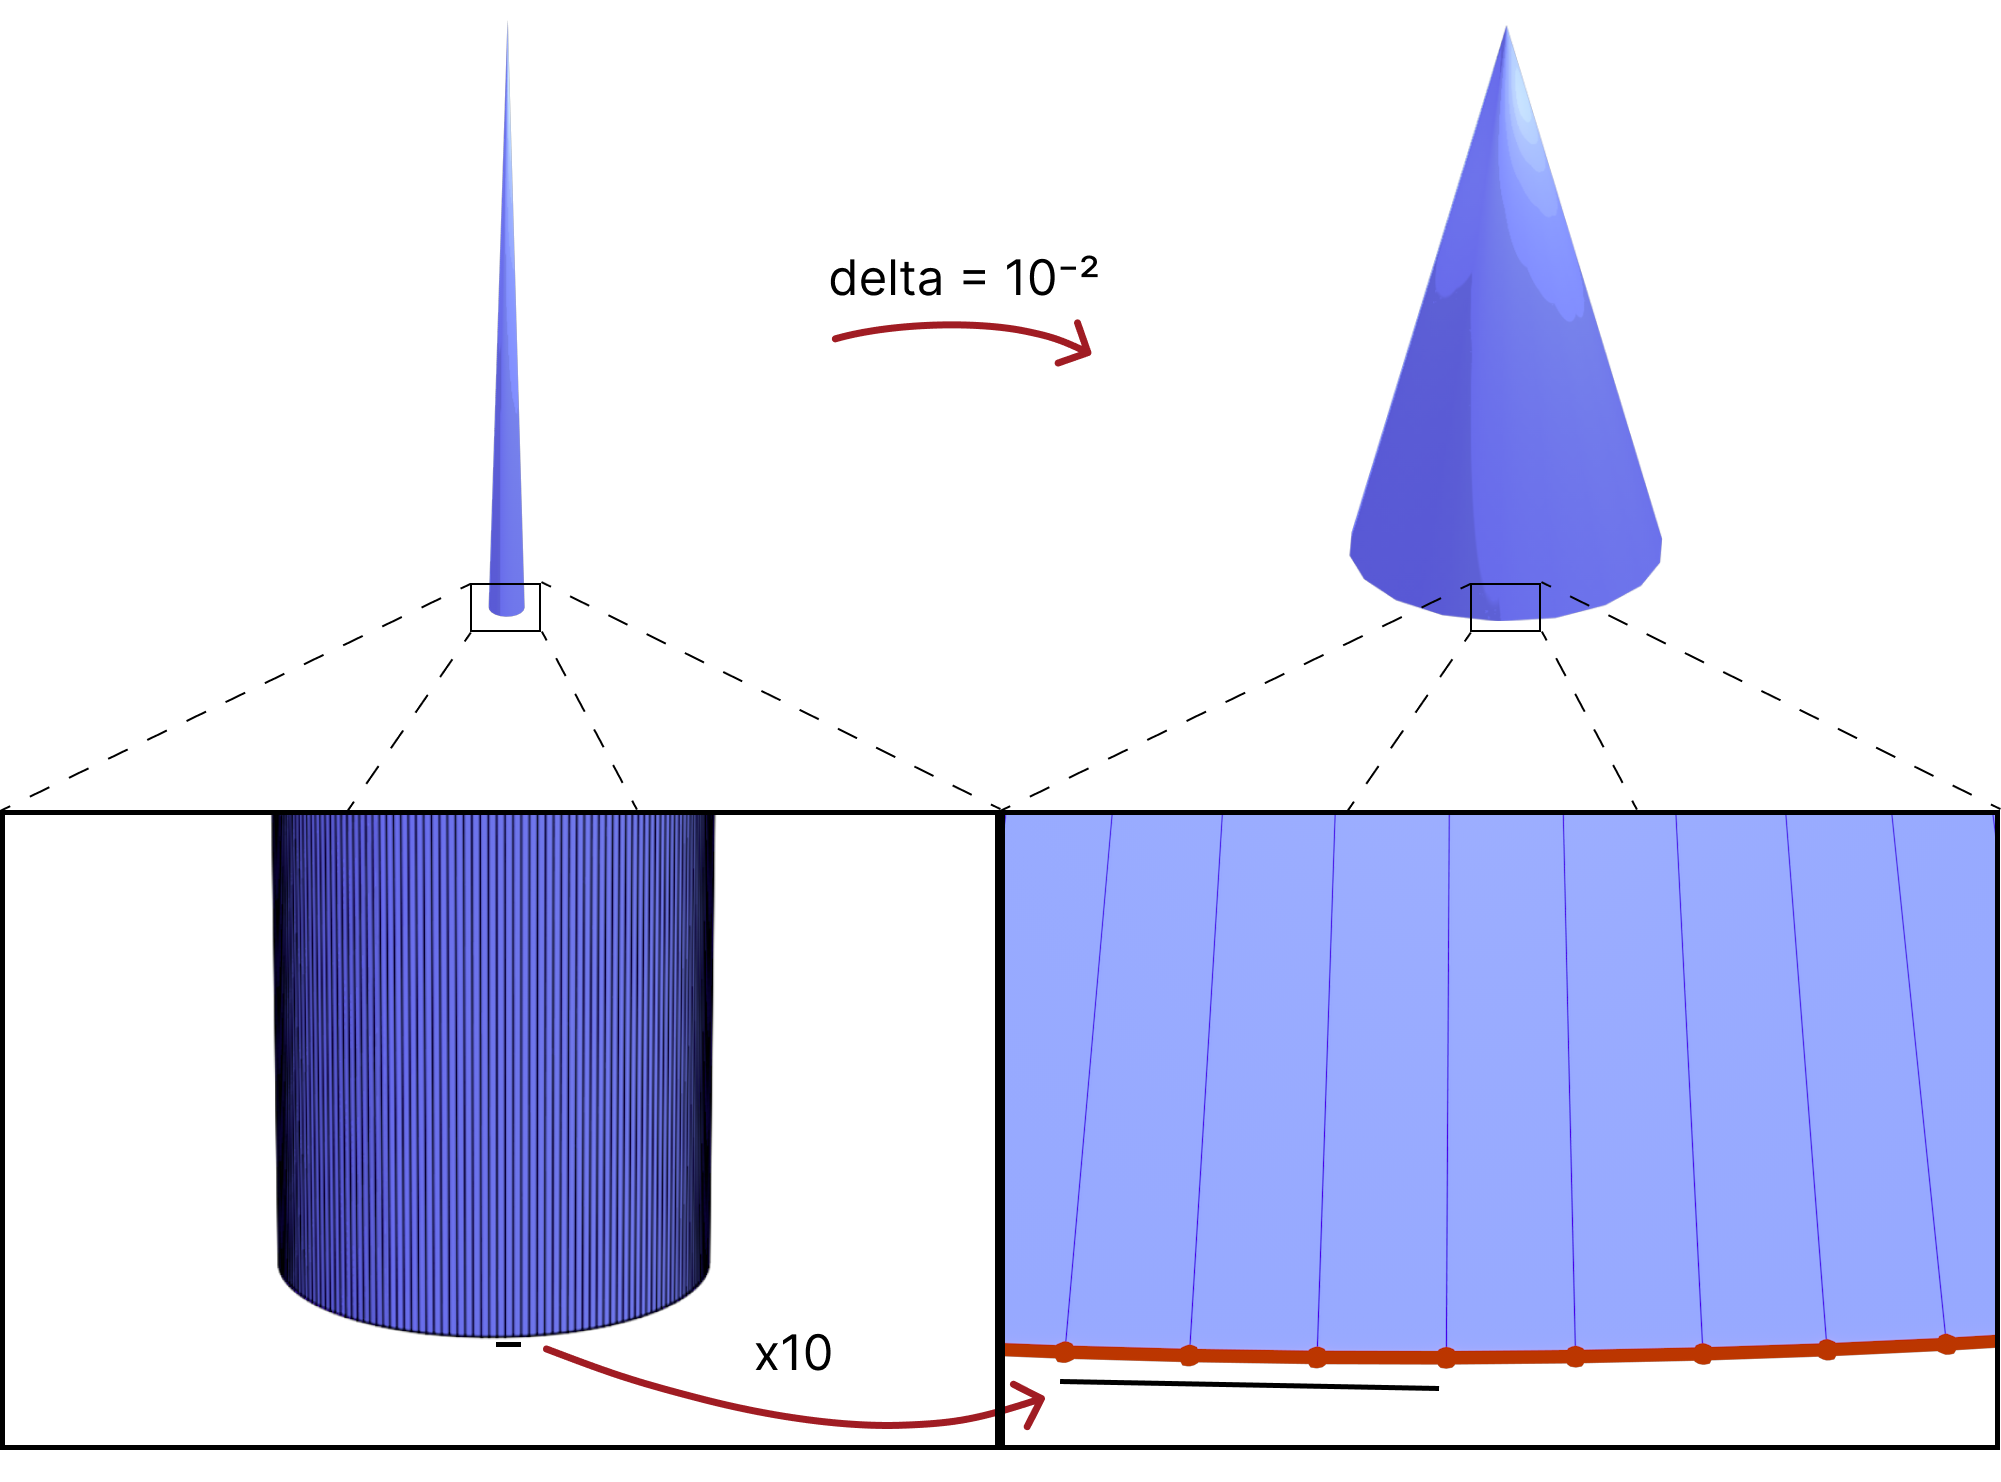
Fig. 38. This shows a tall Cone (\(height = 5 \pi * diameter\)) with 200 faces around the top vertex (left). We can see the effect of Mollification (\(\delta = 10^{-2}\)) on the intrinsic lengths, making base segments x10 times larger and distorting the geometry greatly.

Lastly, In order to greatly reduce the amount of added length and only do that where it is needed, the local schemes sacrifice having the same edge length on both sides of the same edge. The Global schemes we worked on to solve this were either very slow (Linear/Quadratic programs over the whole mesh), or do not converge (sequential pooling schemes). So there is not one clear option that is fast, reliable, does not distort the geometry too much, and keeps edge lengths unbroken. However, that last property does not seem to practically affect the performance. So, some of the local schemes seem to be a favorable choice for a lot of applications.

6.3 Future Work

The work on this project was done in a very short period of time. So, we were not able to explore all the ideas we thought were promising. For example, If we find pooling operations that guarantee the Sequential Pooling schemes converge, then they can be much better alternatives than the global optimization schemes since those are very slow. Moreover, we would get a wide range of variants as we can use any of the local schemes as steps before each pooling iteration. We might even be able to compose such operations in interesting ways.

In this project, we only explored the effects of Mollification on the Laplacian. But it might be useful to apply Mollification before other types of computations where skinny and near-degenerate triangles harm robustness and accuracy and see if Mollification is effective in such cases.

the idea of Intrinsic Mollification is fresh and very flexible. Local schemes even reduce restrictions on the usage of this concept. Hence, we can try to find other usages (and formulations) than fixing skinny triangles. One example is “Intrinsic Delaunay Mollification”. Where we would consider the neighborhood of each edge, (locally) Mollify the 5 involved edge lengths so that the Delaunay condition is satisfied with the least amount of added length. In that case, each edge would have different lengths, but each one would be used in the appropriate iteration of edges around it. The figure below shows a sketch of this idea.
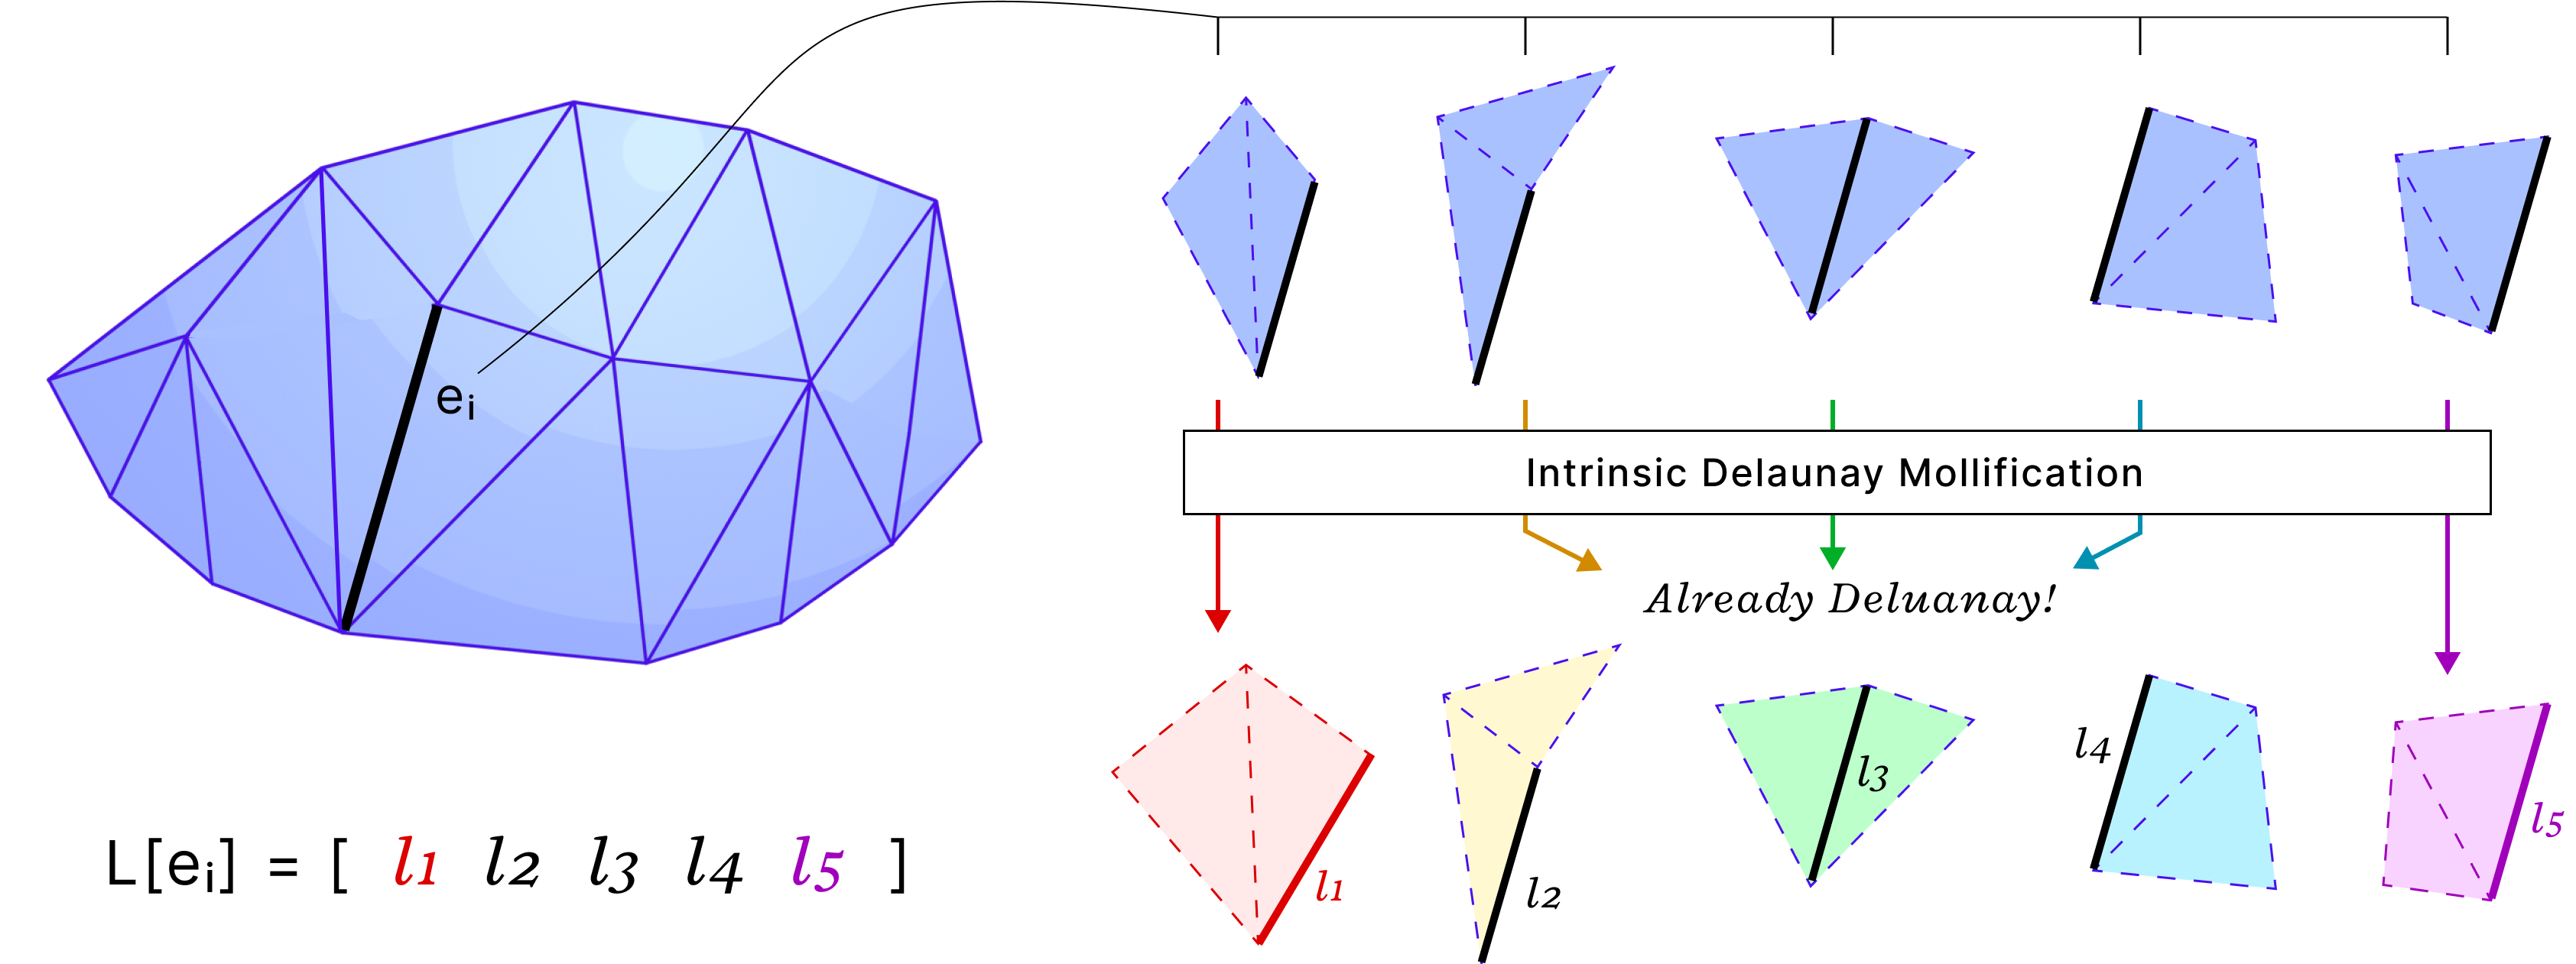
Fig. 39. Intrinsic Delaunay Mollification? We can mollify edge lengths (locally) to get to satisfy the Delaunay condition. In this example, 3 edge neighborhoods already satisfy it with no mollification.

For the Local schemes, it might be worth trying to optimize their time performance by vectorized operations or parallelization. They are relatively fast, but there is some room for optimization there.

As mentioned in 4.7, normalizing to keep some properties unchanged may be a good idea to maintain certain aspects of the shape. Implementing the right normalization operation for the application might indeed be rewarding. One example to try is maintaining the same total area.

One of the most promising ideas is to try to apply this concept to Tetrahedral meshes. Tetrahedral meshes are often used in simulations, material analysis and deformations. These computations can behave poorly with bad-quality tetrahedrons. So, it is a great opportunity to apply the same concepts to this representation. Here, the problem is no longer just linear inequalities, but now we also have a nonlinear determinant condition (Cayley–Menger determinant). Nonetheless, it is a very interesting direction to put some effort into.

References

[1] Sharp Nicholas and Crane Keenan. 2020. A laplacian for nonmanifold triangle meshes. In Computer Graphics Forum, Vol. 39. Wiley Online Library, 69–80.

[2] Jonathan Richard Shewchuk. What Is a Good Linear Finite Element? Interpolation, Conditioning, Anisotropy, and Quality Measures, unpublished preprint, 2002.

[3] Khan, Dawar & Plopski, Alexander & Fujimoto, Yuichiro & Kanbara, Masayuki & Jabeen, Gul & Zhang, Yongjie & Zhang, Xiaopeng & Kato, Hirokazu. (2020). Surface Remeshing: A Systematic Literature Review of Methods and Research Directions. IEEE Transactions on Visualization and Computer Graphics. PP. 1-1. 10.1109/TVCG.2020.3016645.

[4] Fisher, M., Springborn, B., Schröder, P. et al. An algorithm for the construction of intrinsic Delaunay triangulations with applications to digital geometry processing. Computing 81, 199–213 (2007).

[5] Nicholas Sharp, Yousuf Soliman, and Keenan Crane. 2019. Navigating intrinsic triangulations. ACM Trans. Graph. 38, 4, Article 55 (August 2019).

[6] N Sharp, M Gillespie, K Crane. Geometry Processing with Intrinsic Triangulations. SIGGRAPH’21: ACM SIGGRAPH 2021 Courses.

[7] K Crane. 2018. Discrete differential geometry: An applied introduction. Notices of the AMS, Communication 1153.

[8] Zhou, Qingnan and Jacobson, Alec. “Thingi10K: A Dataset of 10,000 3D-Printing Models.” arXiv preprint arXiv:1605.04797 (2016).

[9] Georgia Shay, Justin Solomon, and Oded Stein. A dataset and benchmark for mesh parameterization, 2022., Vol. 1, No. 1, Article. Publication date: October 2023.

[10] Ligang Liu, Chunyang Ye, Ruiqi Ni, and Xiao-Ming Fu. Progressive parameterizations. ACM Trans. Graph., 37(4), jul
2018.

[11] Michael Kazhdan, Jake Solomon, & Mirela Ben-Chen. (2012). Can Mean-Curvature Flow Be Made Non-Singular?.

[12] Bruno Lévy, Sylvain Petitjean, Nicolas Ray, and Jérome Maillot. Least squares conformal maps for automatic texture
atlas generation. ACM Trans. Graph., page 362–371, jul 2002.

[13] Mullen, P., Tong, Y., Alliez, P., & Desbrun, M. (2008, July). Spectral conformal parameterization. In Computer Graphics Forum (Vol. 27, No. 5, pp. 1487-1494). Oxford, UK: Blackwell Publishing Ltd.

[14] Keenan Crane, Marco Livesu, Enrico Puppo, & Yipeng Qin. (2020). A Survey of Algorithms for Geodesic Paths and Distances. arXiv preprint arXiv:2007.10430

[15] Crane, K., Weischedel, C., & Wardetzky, M. (2017). The Heat Method for Distance Computation. Commun. ACM, 60(11), 90–99.

[16] Mitchell, J., Mount, D., & Papadimitriou, C. (1987). The Discrete Geodesic Problem. SIAM Journal on Computing, 16(4), 647-668.
Categories
Research

Reconstruction of Implicit Non-Manifold Surfaces

I. Introduction

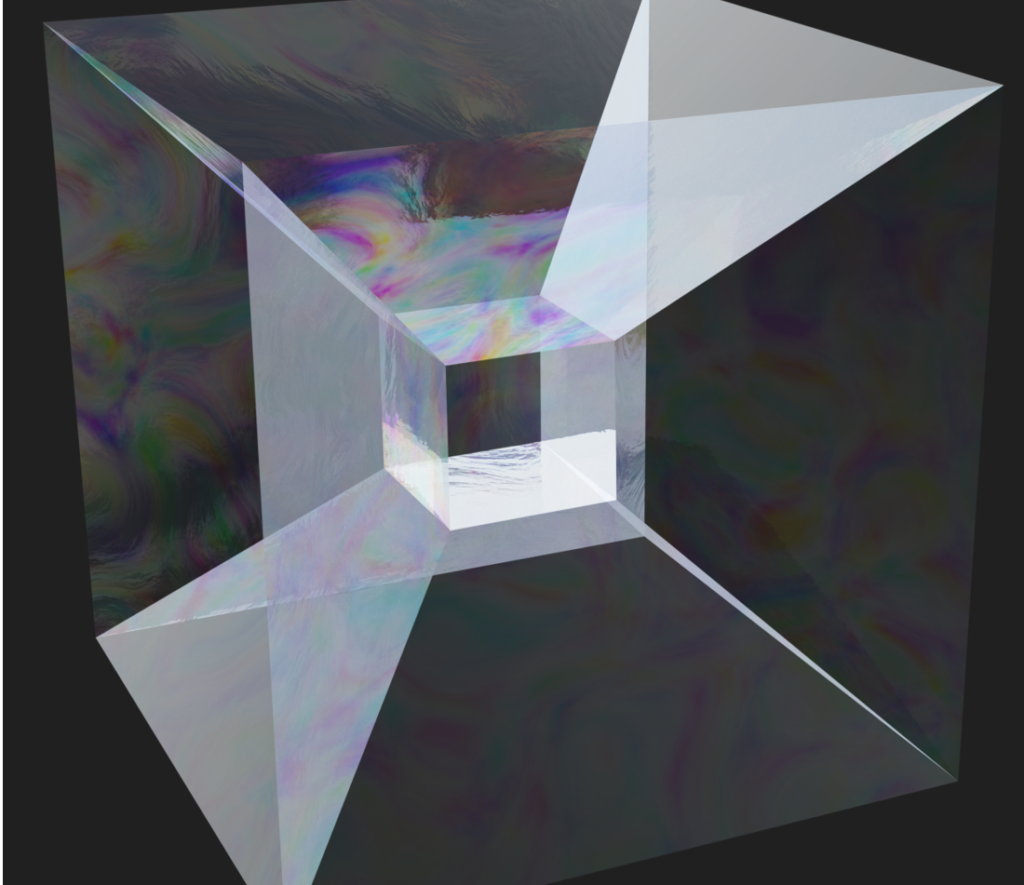
The majority of surfaces in our daily lives are manifold surfaces. Roughly speaking, a manifold surface is one where, if you zoom in close enough at every point, the surface begins to resemble a plane. Most algorithms in computer graphics and digital geometry have historically been tailored for manifold surfaces and fail to preserve or even process non-manifold structures. Non-manifold geometries appear naturally in many settings however. For instance, a dress shirt pocket is sewn onto a sheet of underlying fabric, and these seams are fundamentally non-manifold. Non-manifold surfaces arise in nature in a variety of other settings too, from dislocations in cubic crystals on a molecular level, to the tesseract structures that appear in real world soap films (see Figure 1) [Ishida et al. 2020, Ishida et al. 2017].

Figure 1: Soap film covering the non-manifold minimal surface of a tesseract structure.

The study of soap films connects very closely to a rich vein of study concerning the geometry of minimal surfaces with boundary. The explicit representation of minimal surfaces has a rich history in geometry processing, dating back to the classic paper by Pinkall and Polthier 1993 . Since then, there has been continued study within computer graphics for robust algorithms for computing minimal surfaces, something which is broadly referred to as “Plateau’s Problem”.

Recent work in computer graphics [Wang and Chern 2021] introduced the idea of computing minimal surfaces by solving an “Eulerian” style optimization problem, which they discretize on a grid. In this SGI project, we explored an extension of this idea to the non-manifold setting.

II. Surface Representations

There are multiple ways to digitally represent surfaces, each one with different properties, advantages and disadvantages. Explicit surface representations, such as surface meshes, are easy to model and edit in an intuitive way by artists, but are not very convenient in other settings like constructive solid geometry (CSG). In contrast, implicit surfaces allow to perform morphological operations, and recent advances, such as neural implicits, are also exciting and promising [Xie et al. 2022].

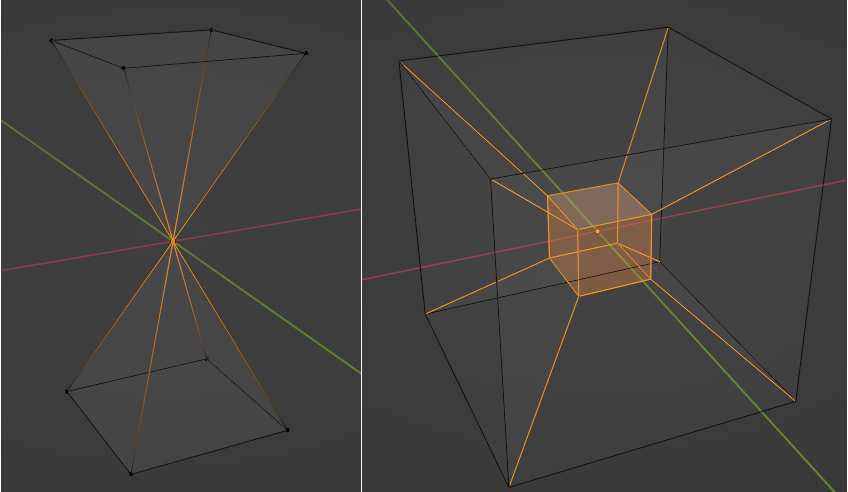
One practical advantage of explicit surface representations like triangle meshes is that they are flexible and intuitive to work with. Triangle meshes are a very natural way to represent manifold surfaces, i.e. surfaces that satisfy the property that the neighborhood of every point is locally similar to the Euclidean plane (or half-plane, in the case of boundaries), and many applications, like 3D printing, require target geometries to be manifold. Triangle meshes can naturally capture non-manifold features as well by including vertices that connect otherwise disjoint triangle fans as in (Figure 2, left) or by edges that are shared by more than two faces (Figure 2, right).

Figure 2: Examples of non-manifold meshes. Non-manifold vertices and edges are highlighted in orange. Left: mesh containing a non-manifold vertex. Right: mesh containing non-manifold edges. Blender highlights faces composed solely by non-manifold edges.

However, in many real world settings, geometric data is not naturally acquired as or represented by a triangle mesh. In applications ranging from medical imaging to constructive solid geometry, the preferred geometric representation is as implicit surfaces.

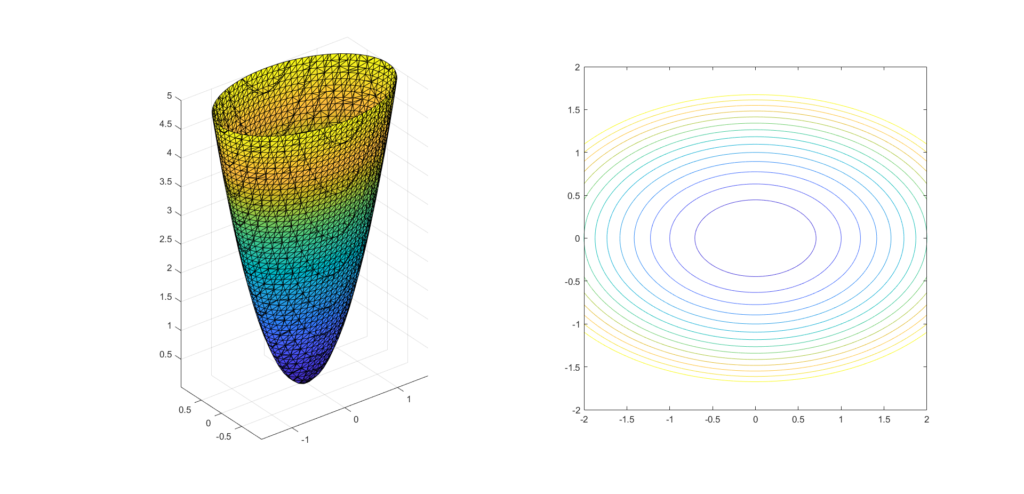
In 2D, implicit surfaces can be described by a function \(f: \mathbb{R}^{2} \rightarrow \mathbb{R}\) that is described by the points \((x, y) \in \mathbb{R}^{2}\) such that \(f(x, y) = c\) for some real value \(c\). By varying the values of \(c\) a set of curves, called level sets, can be used to represent the surface. Figure 3 shows two representations of the same paraboloid, one using an explicit triangle mesh representation (left) and one using level sets of the implicit function (right).

Figure 3: Two distinct representations of the same surface. Left: explicit representation of a hyperboloid using a surface mesh. Right: implicit representation of a hyperboloid using level sets.

While non-manifold features are naturally represented in explicit surface representations, one limitation of implicit surfaces and level sets is that they do not naturally admit a way to represent geometries with non-manifold topology and self-intersections. In this project we focused on studying a way of representing implicit surfaces based on the mathematical machinery of integrable vector fields defined on a background domain.

III. Representing Implicit Surfaces as Integrable Vector Fields

In this project our goal was to explore implicit representations of non-manifold surfaces. To do this, we set out to represent implicit function implicitly, as an integrable vector field.

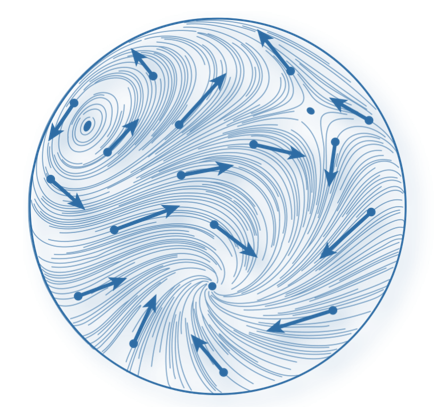
A vector field \(V: \mathbb{R}^{m} \rightarrow \mathbb{R}^{n}\) is a function that corresponds a vector for each point in space. In our case, we are interested in cases where \(m = n = 2\) or \(m = n = 3\); see Figure 4 for an illustration of a vector field defined on a surface.
Vector field design and processing is a vast topic, with enough content to fill entire courses on the subject – we refer the interested reader to Goes et al. 2016 and Vaxman et al. 2016 for details.

Figure 4: Vector field defined on a surface. Source: Goes et al. 2016.

One way of thinking of implicit surfaces is as constant valued level sets of some scalar function defined over the entire domain. Our approach was to represent this scalar function as a function of a vector field which we received as an input to our algorithm.

To reconstruct a scalar field from the vector field, it is necessary to integrate the field, which led us into the discussion of integrability of vector fields. A vector field is integrable when it is the gradient of a scalar function. More precisely, the vector field \(V\) is integrable if there is a scalar function \(f\) such that \(V = \nabla f\).

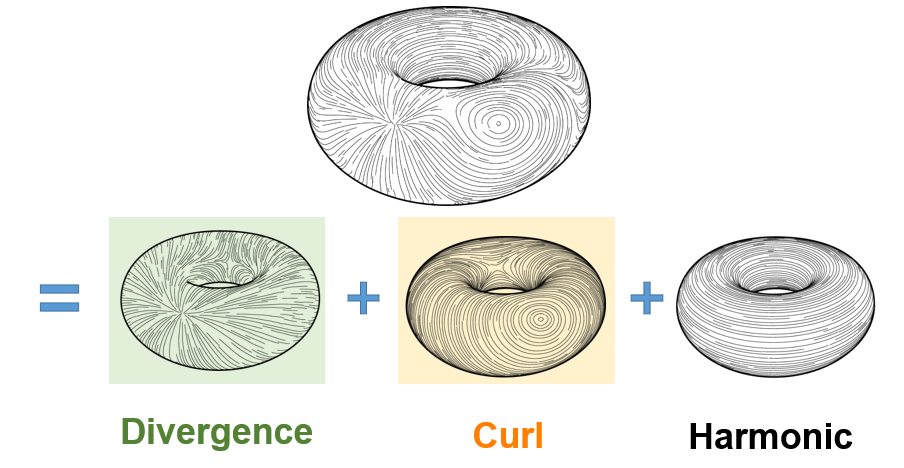
Since it can be arbitrarily hard to find the function \(f\) such that \(V = \nabla f\), or this function may even not exist at all, an equivalent but more convenient condition to check if a vector field is integrable is whether the vector field it is curl-free, that is, if \(\nabla \times V = 0\) for all points in space (Knöppel et al. 2015, Polthier and Preuß 2003). If the vector field is not curl-free, then it is non-integrable, and there is no \(f\) such that \(V = \nabla f\). A possible approach to remove non-integrable features is to apply the Helmholtz-Hodge decomposition, which decomposes the field \(V\) into the sum of three distinct vector fields:

\(\begin{equation} V = F + G + H \end{equation}\)

such that \(F\) is curl-free, \(G\) is divergence-free and \(H\) is a harmonic component. The curl-free \(F\) component is integrable. Figure 5 visualizes this decomposition.

Figure 5: Helmholtz-Hodge decomposition of a vector field defined over a surface. Source: Adapted from Goes et al. 2016.

The non-integrable regions of the vector field correspond to regions where the vector field vanishes or is undefined, also called singularities. For a standard vector field, singular points can be located by checking if the Jacobian is a singular matrix. For implicit non-manifold surfaces, removing the singularities using Helmholtz-Hodge decomposition is not particularly interesting, because the singularities are the cause of the non-manifold features that we want to preserve. At the same time, the singularities prevent the integration of the field, which we wanted to do to reconstruct the levels sets of the implicit function. This dichotomy suggests two different approaches to reconstructing the surface, as described in Section V.

IV. Representing Non-Manifold surfaces as Integrable Frame Fields

Frame Fields or poly-vector fields are generalizations of vector fields which store multiple distinct directions at each point. This terminology was introduced to the graphics literature by Panozzo et. al. 2014, and a technique for generating such integrable fields was presented by Diamanti et. al. 2015.

Animation 1 illustrates one curious phenomenon related to the topology of directional and frame fields. Assume each direction is uniquely labelled (e.g., each different direction is assigned a different color). If you start labelling an arbitrary direction and smoothly circulates around the singularity, trying to consistently label each direction with a unique color, this necessarily causes a mismatch between the initial label and the final label at the starting point. As can be seen in the last frame of the animation, a flow line that was initially assigned a green color was assigned a different color (red) in the last step, characterizing a mismatch between the initial and final label of that flow line. This happens for all the directions.

Animation 1: Failure to uniquely label each flow line direction around a singularity in a directional field. The initial flow line was labelled green. Source: Adapted from Knöppel et al. 2013.

V. Surface Reconstruction

The task can be specifically described as follows: given a frame field defined on a volumetric domain (i.e., a tetrahedral mesh), our goal is to reconstruct a non-manifold surface mesh that represents a non-manifold implicit surface. Two distinct approaches were explored: (i) stream surface tracing based on the alignment of the vector fields and (ii) Poisson surface reconstruction.

V.1. Stream Surface Tracing

The first approach consisted in using stream surfaces to represent the non-manifold surface. Stream surfaces are surfaces whose normal are aligned with one of the three vectors of the frame field. These types of surfaces are usually employed to visualize flows in computational fluid dynamics (Peikert and Sadlo 2009). Many ideas of the algorithm we explored are inspired by Stutz et al. 2022, which further extends the stream surface extraction with an optimization objective to generate multi-laminar structures for topology optimization tasks.

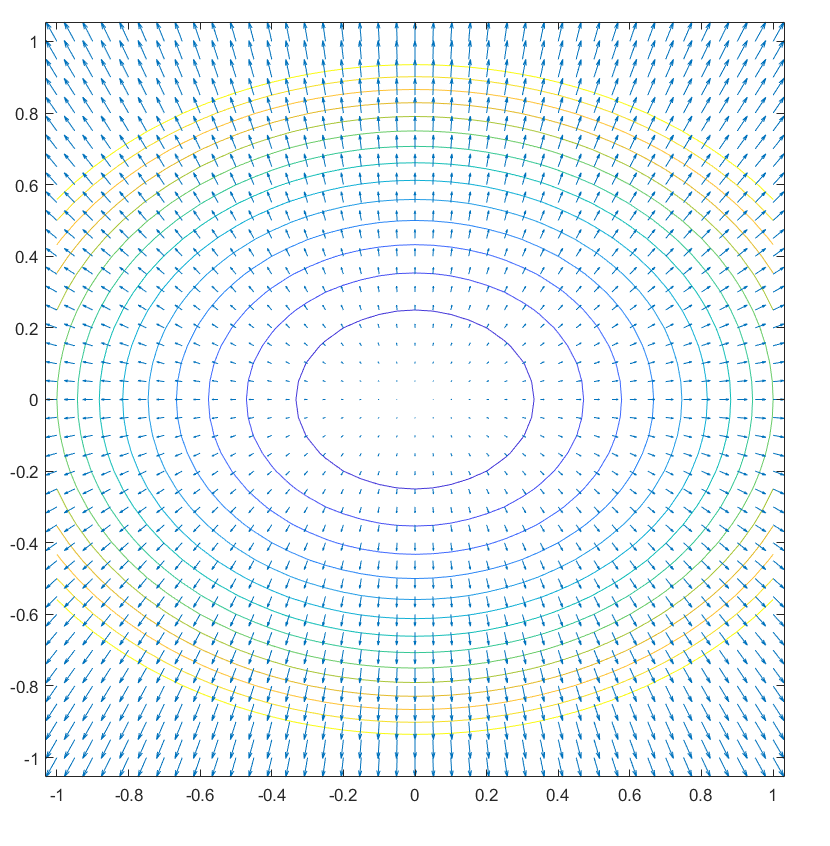
It is known that the gradient \(\nabla f\) of a function \(f\) is perpendicular to the level sets of the function (see Figure 6 for a visual demonstration). Therefore, if we had the gradient of the function, it would be possible to extract a surface by constructing a triangle mesh whose normal vectors of each face are given by the gradient of the function. The main idea of the stream surface tracing is that the input frame field can be used as an approximation of the gradient of the function that we are trying to reconstruct. In other words, the normal vector of the surface is aligned with one of the vectors of the frame field.

Figure 6: the gradient \(\nabla f\) of a function \(f\) is perpendicular to the level sets of \(f\).

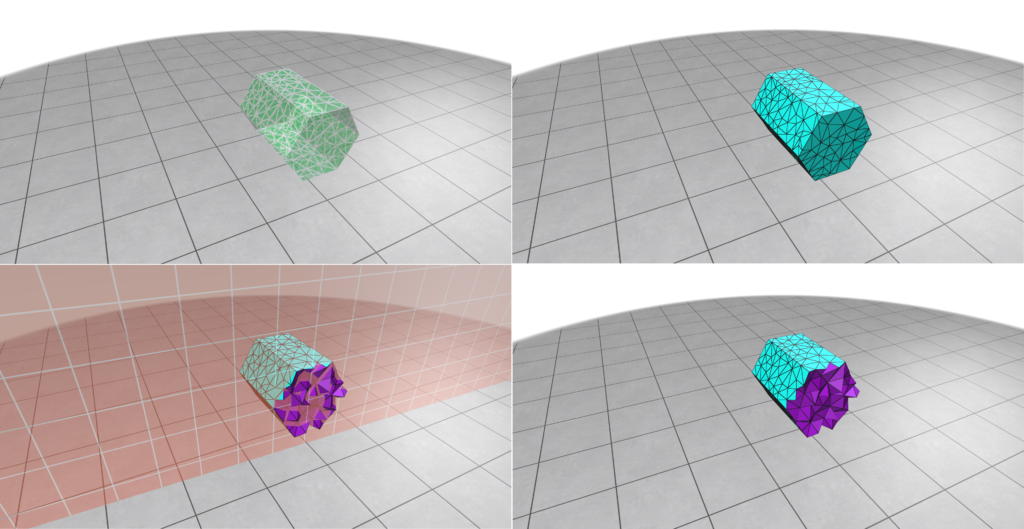
Animation 2 displays a step-by-step sequence for the first two tetrahedrons that are visited by the stream surface tracing algorithm, that proceeds as follows:

  1. Choose an initial tetrahedron to start the tracing;
  2. Compute the centroid of the first tetrahedron;
  3. Choose one of the (three) vectors of the frame field as a representative of the normal vector of the surface;
  4. Intersect a plane with the centroid of the tetrahedron such that the previous chosen vector is normal to this plane;
  5. Choose a neighbor tetrahedron that shares a face with the edges that were intersected in the previous step;
  6. For the new tetrahedron, compute the centroid and choose a vector of the frame field (similar to steps 2 and 3);
  7. Project the midpoint of the edge of the previous plane into a line that passes through the centroid of the new tetrahedron.
  8. Intersect a plane with the point computed in the previous step and the new tetrahedron.
  9. Repeat steps 5 through 8 until all tetrahedrons are visited.

After repeating the procedure for all the tetrahedrons in the volumetric domain, a stream surface is extracted that tries to preserve non-manifold features.

Animation 2: Illustration of the main steps of the stream surface algorithm applied to the first two tetrahedra. This procedure is repeated for all tetrahedra in the volumetric domain.
V.1.1 – Results using Vector Fields

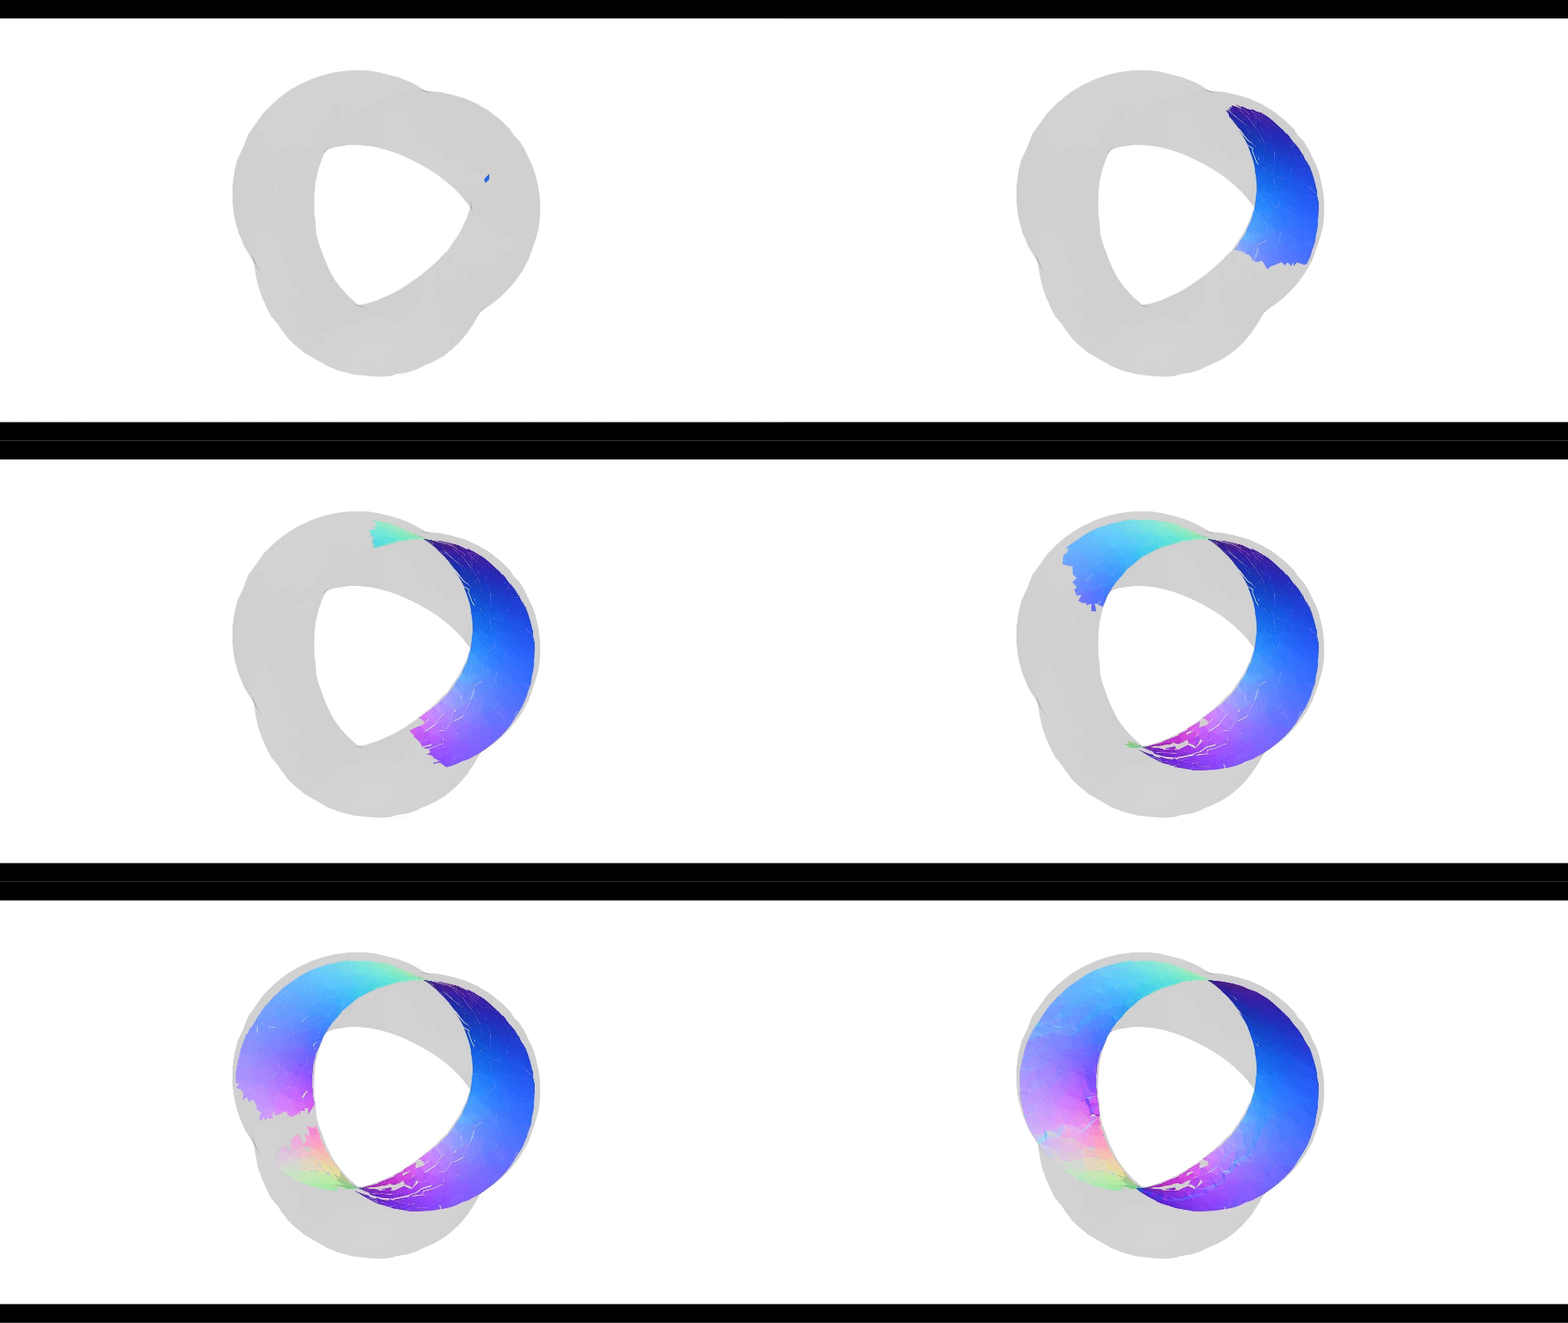
Animation 3 demonstrates the stream surface tracing algorithm for a frame field defined on a volumetric domain. In this case, it can be seen that the algorithm extracts a Möbius strip, which is a non-orientable manifold surface.

Animation 3: Stream surface tracing incrementally reconstructing a Möbius strip.

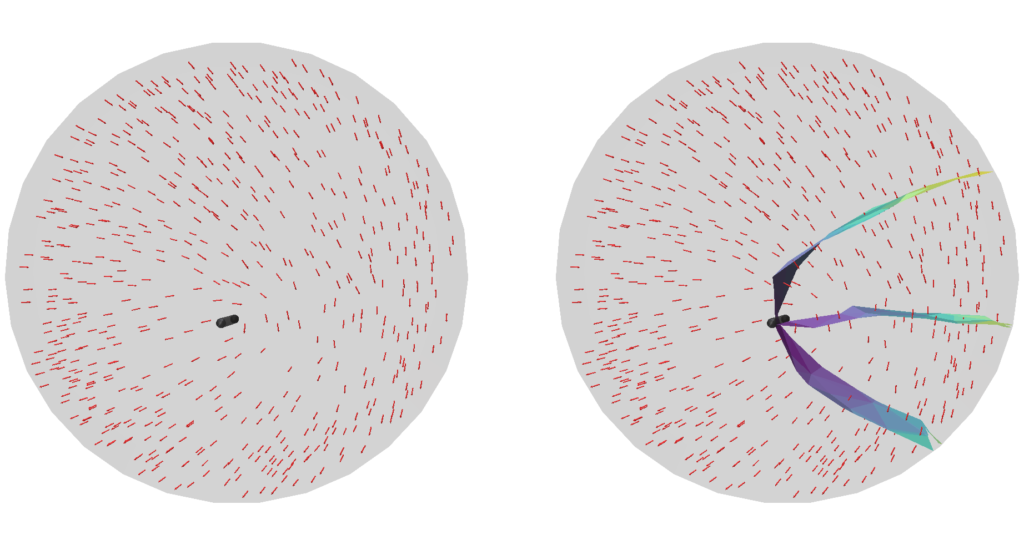
However, the Möbius strip is still a manifold surface and we want to reconstruct non-manifold surfaces. As an example of a surface with non-manifold structures, consider Figure 7. Figure 7, left, shows a frame field and the singularity graph associated with it, while Figure 7, right, presents the surface by the algorithm. The output of the algorithm is a surface mesh containing a non-manifold vertex in the neighborhood of the singular curve, indicating the non-integrability of the field.

Figure 7: Left: frame field and associated singular curve. Right: surface extracted using the surface tracing algorithm. Notice the formation of a T-junction in the neighborhood of the singular curve.

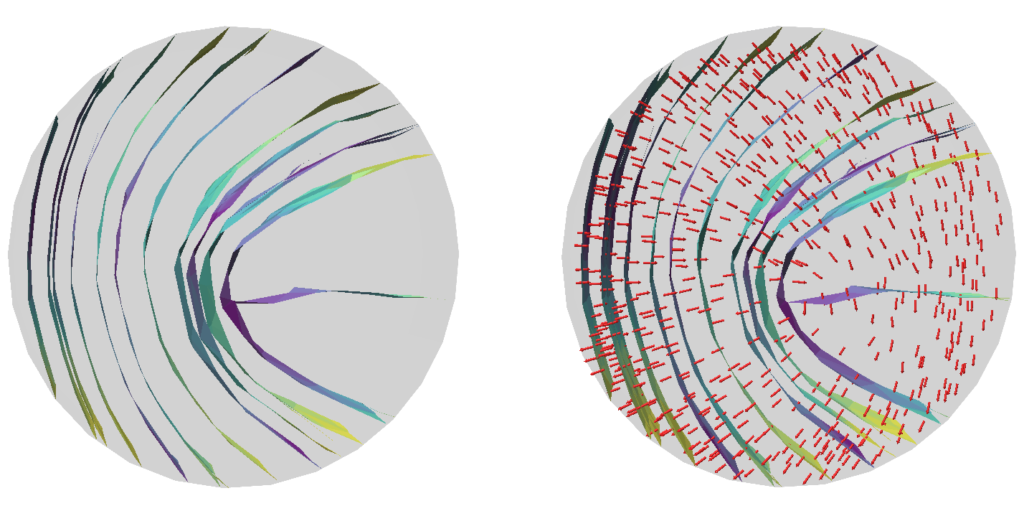
By applying the stream surface tracing algorithm starting from different tetrahedrons, it is possible to trace multiple level sets of the implicit non-manifold surface. Figure 8 displays the result of such procedure, where multiple strips were extracted corresponding to different level sets. Figure 8, right, shows the frame field together with the extracted surfaces: here, it is possible to notice that each vector is approximately normal to the surfaces. This was expected, since the assumption of the algorithm was that the frame field can be used as an approximation of the gradient of the function we want to reconstruct.

Figure 8: Left: reconstructed surfaces for different level sets of the function. Right: surfaces and the corresponding vector field. Notice how the vectors are roughly orthogonal to the level sets, as expected.
V.1.2. Volumetric Frame Fields: Working with Frame Fields in 3D volumes

Implicit functions, as described above, are real-valued functions with infinitely many values. To represent them on a computer, some sort of spatial discretization is necessary. Two common choices are to discretize the space using regular grids or unstructured meshes where each element is a triangle or a tetrahedron. This discretization corresponds to an Eulerian approach: for a fixed discretized domain, the values of the vector fields associated with the implicit functions are observed in fixed locations in space. In this project, tetrahedral meshes are used to discretize the space and fill the volume where the functions are defined.

A tetrahedral mesh is similar to a triangle mesh, but augmented with additional data for each tetrahedron. Formally, a tetrahedral mesh \(\mathcal{M}\) is defined by a set \({\mathcal{V}, \mathcal{E}, \mathcal{F}, \mathcal{T}}\) of vertices, edges, faces and tetrahedrons, respectively. Each tetrahedron is composed of 4 vertices, 6 edges and 4 faces. The edges and faces of one tetrahedron may be shared with adjacent tetrahedrons, which allow to traverse the mesh. More importantly, this allows to define the vector field using the tetrahedral mesh as a background domain to discretize the function over this volumetric space.

As input, we start with a boundary mesh enclosing a volume (Figure 9, top left). Bear in mind that this boundary mesh does not fill the space, but only specifies the boundary of a region of interest. We can fill the volume using a tetrahedral mesh (Figure 9, top right). This tetrahedralization can be done using Fast Tetrahedral Meshing in the Wild, for instance. It is important to notice that, in contrast to a surface polygon mesh, a tetrahedral mesh is a volume mesh in the sense that it fills the volume enclosed by it. If we slice the tetrahedral mesh with a plane (Figure 9, bottom left and bottom right), we can see that the interior of the tetrahedral mesh is not empty (as would be the case for a surface mesh) and that the interior volume is fully filled. In Figure 9, the interior faces of the tetrahedrons were colored in purple while the boundary faces were colored in cyan.

Figure 9: Tetrahedralization of a boundary domain. Starting with a boundary domain bounded by a surface mesh (top left), the domain is discretized using tetrahedrons (top right). Unlike a surface mesh, a volumetric mesh fills the interior space of the volume it discretizes (bottom row).

Three distinct vector fields \(U, V, W\) constitute a volumetric frame field if they form an orthonormal basis at each point in space. As mentioned, we work with frame fields defined on a volumetric domain as a representation of the implicit non-manifold surface. Each tetrahedron will be associated with three orthogonal vectors, as shown in Figure 10.

Figure 10: Sample of data used to represent a non-manifold implicit surface. The domain was discretized using tetrahedral meshes (purple). Each tetrahedron is associated with three orthogonal vectors, that constitute a volumetric frame field.

The previous idea of labelling directions around a point can be useful to detect singularities in our frame fields. The same idea can be extended to volumetric frame fields, where singularities create singular curves on the volumetric domain. These curves are denominated as singularity graphs. Figure 11 shows the singularity graphs for some frame fields. See Nieser et al. 2011 for details. Identifying the singular curves on the frame fields is equivalent to identifying its non-integrable regions.

Figure 11: Singularity graphs of the volumetric frame fields.
V.1.3. Results using Volumetric Frame Fields

Another example is provided in Figure 12, where the volumetric frame field is defined on a hexagonal boundary mesh. The output presents a non-manifold junction through a non-manifold vertex.

Figure 12: reconstructed surface for a hexagonal boundary mesh.

As a harder test case, it can be seen in Figure 13 that the resulting surface extracted by the algorithm is not a perfectly closed mesh. While the surface tries to follow the singularity graph (in green), it fails to self-intersect in some regions, creating undesirable gaps.

Figure 13: reconstructed surface for a tetrahedral boundary mesh and the singularity graph (in green) associated with the volumetric frame field. The surface has an overall structure that resembles the junction present in the singularity graph, but in this case the algorithm wasn’t able to extract a mesh without holes.

Finally, we tested the algorithm to reconstruct the non-manifold minimal tesseract, presented in Figure 1. Two points of view of the output are presented in Figure 14. While the traced mesh has a structure similar to the desired surface, the result could still be further improved. The mesh presents cracks in the surface and some almost disconnected regions. We applied hole filling algorithms, such as those provided by MeshLab, as an attempt to fix the issue, but they weren’t capable of closing the holes for any combination of parameters tested.

Figure 14: reconstructed surface for the non-manifold minimal surface tesseract. The reconstruction preserves the overall structure of the desired surface. However, the algorithm fails to create a surface without holes and produces some regions that are mostly disconnected from the surface.

V.2. Poisson Surface Reconstruction

The second approach consisted in investigating the classic Poisson Surface Reconstruction algorithm by Kazhdan et al. 2006 for our task. Specifically, our goal was to evaluate whether the non-manifold features were preserved using this approach and, if not, where exactly it fails.

Given a differentiable implicit function \(f\), we can compute its gradient vector field \(G = \nabla f\). This can be done either analytically, if there is a closed-formula for \(f\), or computationally, using finite-element methods or discrete exterior calculus. Conversely, given a gradient vector field \(G\), we can integrate \(G\) to compute the implicit function \(f\) that generates the starting vector field.

Note that since it was assumed that \(G\) is a gradient vector field, and not an arbitrary vector field, this means that \(G\) is integrable. If this is the case, we know that a function \(f\) whose gradient vector field is \(G\) exists; we just need to find it. However, in practice, the input of the algorithm may be a vector field \(V\) which is not exactly integrable due to noise or sampling artifacts. How can \(f\) be computed in all these cases?

One core idea of the Poisson Surface Reconstruction algorithm consists in reconstructing \(f\) using a least-squares optimization formulation:

\(\begin{equation} \tilde{f} = \arg \min_{f} \left |V – \nabla f \right |^{2} \end{equation}\)

For a perfectly integrable vector field (i.e., a gradient vector field), it would theoretically be possible to compute \(\tilde{f} = f\) such that \(\nabla \tilde{f} = V\) and reconstruct \(f\) exactly. The advantage of this formulation is that even in cases where the vector field \(V\) is not exactly integrable, it will reconstruct the best approximation of \(f\) by minimizing the least-squares error.

In the case of our frame fields representing non-manifold surfaces, the existence of singularities in the field means that it will necessarily be non-integrable. It is expected that the equality \(\nabla \tilde{f} = V\) fails precisely in the regions containing singular points, but we wanted to evaluate the performance of a classic algorithm on our data.

V.2.1 – Results using Volumetric Frame Fields

Figure 15 and Figure 16 present comparisons between the surface extracted by Stream Surface Tracing and Poisson Surface Reconstruction algorithm for two different inputs. While for the hexagonal boundary mesh (Figure 15) both algorithms have a similar output, for the tetrahedral boundary mesh (Figure 16) Poisson Surface Reconstruction generates a surface closer to the desired non-manifold junction.

Figure 15: Comparison between the Stream Surface Tracing algorithm (left) and the Poisson Surface Reconstruction (right) for the volumetric frame field with hexagonal boundary mesh.
Figure 16: Comparison between the Stream Surface Tracing algorithm (left) and the Poisson Surface Reconstruction (right) for the volumetric frame field with tetrahedral boundary mesh. In this case, Poisson Surface Reconstruction extracts a surface that is closer to the desired junction in comparison to the Stream Surface Tracing.

Remarkably, the Poisson Surface Reconstruction fails badly for the non-manifold tesseract, as shown in Figure 17. While the Stream Surface Tracing doesn’t extract a perfect surface reconstruction (Figure 17, left), it is much closer to the tesseract than the surface reconstructed by the Poisson Surface Reconstruction (Figure 17, right).

Figure 17: Comparison between the Stream Surface Tracing algorithm (left) and the Poisson Surface Reconstruction (right) for the volumetric frame field defined for the tesseract structure. In this case, Poisson Surface Reconstruction drastically fails to preserve the non-manifold structure of the target surface.

VI. Conclusions and Future Work

In this project we explored multiple surface reconstruction algorithms that could possibly preserve non-manifold structures from frame fields defined on tetrahedral domains. While the algorithms could extract surfaces that present the overall structure desired, for many inputs the mesh displayed artifacts such as cracks or components that aren’t completely connected, such as non-manifold vertices where a non-manifold edge was expected. As future work, we consider using the singularity graph to guide the tracing as an attempt to close the holes in the mesh. Another possible direction would be to explore the usage of the singularity graph in the optimization process used in the Poisson Surface Reconstruction algorithm.

I would like to thank Josh Vekhter, Nicole Feng and Marco Ravelo for the mentoring and patience to guide me through the rich and beautiful theory of frame fields. Furthermore, I would like to thank Justin Solomon for the hard work on organizing SGI and baking beautiful singular pies.

VII. References

Ishida, Sadashige, et al. “A model for soap film dynamics with evolving thickness.” ACM Transactions on Graphics (TOG) 39.4 (2020): 31-1.

Ishida, Sadashige, et al. “A hyperbolic geometric flow for evolving films and foams.” ACM Transactions on Graphics (TOG) 36.6 (2017): 1-11.

Pinkall, Ulrich, and Konrad Polthier. “Computing discrete minimal surfaces and their conjugates.” Experimental mathematics 2.1 (1993): 15-36.

Wang, Stephanie, and Albert Chern. “Computing minimal surfaces with differential forms.” ACM Transactions on Graphics (TOG) 40.4 (2021): 1-14.

Xie, Yiheng, et al. “Neural fields in visual computing and beyond.” Computer Graphics Forum. Vol. 41. No. 2. 2022.

De Goes, Fernando, Mathieu Desbrun, and Yiying Tong. “Vector field processing on triangle meshes.” ACM SIGGRAPH 2016 Courses. 2016. 1-49.

Vaxman, Amir, et al. “Directional field synthesis, design, and processing.” Computer graphics forum. Vol. 35. No. 2. 2016.

Knöppel, Felix, et al. “Stripe patterns on surfaces.” ACM Transactions on Graphics (TOG) 34.4 (2015): 1-11.

Polthier, Konrad, and Eike Preuß. “Identifying vector field singularities using a discrete Hodge decomposition.” Visualization and mathematics III. Springer Berlin Heidelberg, 2003.

Panozzo, Daniele, et al. “Frame fields: Anisotropic and non-orthogonal cross fields additional material.” Proceedings of the ACM TRANSACTIONS ON GRAPHICS (PROCEEDINGS OF ACM SIGGRAPH (2014).

Diamanti, Olga, et al. “Integrable polyvector fields.” ACM Transactions on Graphics (TOG) 34.4 (2015): 1-12.

Knöppel, Felix, et al. “Globally optimal direction fields.” ACM Transactions on Graphics (ToG) 32.4 (2013): 1-10.

Peikert, Ronald, and Filip Sadlo. “Topologically relevant stream surfaces for flow visualization.” Proceedings of the 25th Spring Conference on Computer Graphics. 2009.

Stutz, Florian Cyril, et al. “Synthesis of frame field-aligned multi-laminar structures.” ACM Transactions on Graphics (TOG) 41.5 (2022): 1-20.

Hu, Yixin, et al. “Fast tetrahedral meshing in the wild.” ACM Transactions on Graphics (TOG) 39.4 (2020): 117-1.

Nieser, Matthias, Ulrich Reitebuch, and Konrad Polthier. “Cubecover–parameterization of 3d volumes.” Computer graphics forum. Vol. 30. No. 5. Oxford, UK: Blackwell Publishing Ltd, 2011.

Kazhdan, Michael, Matthew Bolitho, and Hugues Hoppe. “Poisson surface reconstruction.” Proceedings of the fourth Eurographics symposium on Geometry processing. Vol. 7. 2006.

Categories
Research

Design and Simulation of Kirigami Linkages

Video 1: A kirigami linkage is deformed to satisfy geometric and physical constraints using a constrained optimization method.

By SGI Fellows: Matheus da Silva Araujo and Shalom Bekele

Mentor: Mina Konaković Luković

Volunteers: Nicole Feng

I. Introduction

Kirigami is the Japanese art of creating 3D forms and sculptures by folding and cutting flat sheets of paper. However, its usages can be extended beyond artistic purposes, including material science, additive fabrication, and robotics [1, 2, 3]. In this project, mentored by Professor Mina Konaković Luković, we explored a specific regular cutting pattern called auxetic linkages, whose applications range from architecture [4] to medical devices [5], such as heart stents. For instance, thanks to the use of auxetic linkages, the Canopy Pavilion at EPFL (Lausanne, Switzerland) provides optimal shading while consuming less physical material. Specifically, we studied how to create these kirigami linkages computationally and how to satisfy their geometric and physical constraints as they deform. Video 1 demonstrates the results of deforming a kirigami linkage using the shape deformation techniques investigated in this project.

II. Auxetic Linkages

Auxetic linkages can be created through a specific cutting pattern that allows materials that would otherwise be inextensible to uniformly stretch up to a certain limit. This process provides further flexibility to represent a larger space of possible shapes because it makes it possible to represent shapes with non-zero Gaussian curvature. Figure 1 shows a real-life piece of cardboard cut using a rotating squares pattern.

Figure 1: Example of cardboard cut using an auxetic cutting pattern. Source: Auxetics & Metamaterials (+Grasshopper Tutorial).

One possible way to generate a triangle mesh representing this particular pattern consists in creating a regular grid and implementing a mesh cutting algorithm. The mesh cutting is used to cut slits in the regular grid such that the final mesh represents the auxetic pattern. An alternative approach leverages the regularity of the auxetic pattern and generates the mesh by connecting an arrangement of rotating squares at its hinges [6].

III. As-Rigid-As-Possible Shape Deformation

To simulate and interact with kirigami linkages, we explored different algorithms to interactively deform these shapes while attempting to satisfy the geometric and physical constraints, such as rigidity and resistance to stretching.

The goal of shape deformation methods is to deform an initial shape while satisfying specific user-supplied constraints and preserving features of the original surface. Suppose a surface \(\mathcal{S}\) is represented by a triangle mesh \(\mathcal{M}\) with a set of vertices \(\mathcal{V}\). The user can constrain that some subset of vertices \(\mathcal{P} \in \mathcal{V}\) must be pinned or fixed in space while a different subset of vertices \(\mathcal{H} \in \mathcal{V}\) may be moved to arbitrary positions, e.g., moved using mouse drag as input. When vertices \(\mathcal{P}\) are fixed and vertices \(\mathcal{H}\) are moved, what should happen to the remaining vertices \(\mathcal{R} = \mathcal{V} \setminus (\mathcal{P} \cup \mathcal{H})\) of the mesh? The shape deformation algorithm must update the positions of the vertices \(\mathcal{R}\) in such a way that the deformation is intuitive for the user. For instance, the deformation should preserve fine details of the initial shape.

There are a lot of ways to try to define a more precise definition of what an “intuitive” deformation would be. A common approach is to define a physically-inspired energy that measures distortions introduced by the deformation, such as bending and stretching. This can be done using intrinsic properties of the surface. A thin shell energy based on the first and second fundamental forms is given by

\(\begin{equation}
E(\mathcal{S}, \mathcal{S}’) = \iint_{\Omega} k_{s} \| \mathbf{I}'(u, v) – \mathbf{I}(u, v) \|^{2} + k_{b} \| \mathbf{II}'(u, v) – \mathbf{II}(u, v) \|^{2} \text{d}u \text{d}v
\end{equation}\)

where \(\mathbf{I}, \mathbf{II}\) are the first and second fundamental forms of the original surface \(\mathcal{S}\), respectively, and \(\mathbf{I}’, \mathbf{II}’\) are the corresponding fundamental forms of the deformed surface \(\mathcal{S}’\), respectively. The parameters \(k_{s}\) and \(k_{b}\) are weights that represent the resistance to stretching and bending. A shape deformation algorithm aims to minimize this energy while satisfying the user-supplied constraints for vertices in \(\mathcal{H}, \mathcal{P}\). Animation 1 displays the result of a character being deformed. See Botsch et al. 2010 [7] for more details and alternative algorithms for shape deformation.

Animation 1: Shape deformation of a character using the implementation of libigl.

The classic as-rigid-as-possible [8] algorithm (also known as ARAP) is one example of a technique that minimizes the previous energy. The observation is that deformations that are locally as-rigid-as-possible tend to preserve fine details while trying to satisfy the user constraints. If the deformation from shape \(\mathcal{S}\) to \(\mathcal{S}’\) is rigid, it must be possible to find a rotation matrix \(\mathbf{R}_{i}\) that rigidly transforms (i.e., without scaling or shearing) one edge \(\mathbf{e}_{i, j} \) with endpoints \(\mathbf{v}_{i}, \mathbf{v}_{j}\) of \(\mathcal{S}\) into one edge \(\mathbf{e}_{i, j}’\) with endpoints \(\mathbf{v}_{i}’, \mathbf{v}_{j}’\) of \(\mathcal{S}’\):

\(\begin{equation}
\mathbf{v}_{i}’ – \mathbf{v}_{j}’ = \mathbf{R}_{i}(\mathbf{v}_{i} – \mathbf{v}_{j})
\end{equation}\)

The core idea of the method is that even when the deformation is not completely rigid, it is still possible to find the as-rigid-as-possible deformation (as implied in the name of the algorithm) by solving a minimization problem in the least-squares sense:

\(\begin{equation}
E(\mathcal{S}, \mathcal{S}’) = \sum_{i}^{n} w_{i} \sum_{j \in \mathcal{N}(i)} w_{ij} \| (\mathbf{v}_{i}’ – \mathbf{v}_{j}’) – (\mathbf{R}_{i} (\mathbf{v}_{i} – \mathbf{v}_{j})) \|^{2}
\end{equation}\)

The weights \(w_{i}\) and \(w_{ij}\) are used to make the algorithm more robust against discretization bias. In other words, depending on the mesh connectivity, the result may exhibit undesirable asymmetrical deformations. To mitigate these artifacts related to mesh dependence, Sorkine and Alexa [8] chose \(w_{i} = 1\) and \(w_{ij} = \frac{1}{2}(\cot \alpha_{ij} + \cot \beta_{ij})\), where \(\alpha_{ij}\) and \(\beta_{ij}\) are the angles that oppose an edge \(e_{ij}\). It is worth noting that the choice of \(w_{ij}\) corresponds to the cotangent-Laplacian operator, which is widely used in geometry processing.

Note that the positions of the vertices in \(\mathcal{H}\) and \(\mathcal{P}\) are known, since they are explicitly specified by the user. Hence, this equation has two unknowns: the positions of the vertices in \(\mathcal{R}\) and the rotation matrix \(\mathbf{R}_{i}\). ARAP solves this using an alternating optimization strategy:

  1. Define arbitrary initial values for \(\mathbf{v}_{i}’\) and \(\mathbf{R}_{i}\);
  2. Assume that the rotations are fixed and solve the minimization for \(\mathbf{v}_{i}’\);
  3. Using the solutions found in the previous step for \(\mathbf{v}_{i}’\), solve the minimization for \(\mathbf{R}_{i}\);
  4. Repeat steps (2) and (3) until some condition is met (e.g., a maximum number of iterations is reached).

By repeating this alternating process, the deformation energy is minimized and the as-rigid-as-possible solution can be computed. Video 2 shows our results using the ARAP implementation provided by libigl applied to a kirigami linkage. While one vertex on the top-row is constrained to be fixed in a position, the user can drag other vertices.

Video 2: As-rigid-as-possible shape deformation of a kirigami linkage.

IV. Constraint-Based Shape Optimization

While ARAP is a powerful method, it is restricted to local feature preservation through rigid motions. Shape-Up [9] proposes a unified optimization strategy by defining shape constraints and projection operators tailored for specific tasks, including mesh quality improvement, parameterization and shape deformation. This general constraint-based optimization approach provides more flexibility: not only can it be applied to different geometry processing applications beyond shape deformation, but it also can be applied to point clouds, polygon meshes and volumetric meshes. Besides geometric constraints, this optimization method can be further generalized using projective dynamics [10] to incorporate physical constraints such as strain limiting, volume preservation or resistance to bending.

A set of \(m\) shape constraints \({ C_{1}, C_{2} , …, C_{m} }\) are used to describe desired properties of the surface. The shape projection operator \(P_{i}\) is responsible for projecting the vertices \(\mathbf{x}\) of the shape into the constraint set \(C_{i}\), i.e., finding the closest point to \(\mathbf{x}\), \(\mathbf{x}^{*}\), that satisfies the constraint \(C_{i}\). The nature of the constraints is determined by the application; for instance, physical and geometric constraints can be chosen based on fabrication requirements. A proximity function \(\mathbf{\phi}(\mathbf{x})\) is used to compute the weighted sum of squared distances to the set of constraints:

\(\begin{equation} \label{eq:optim-shapeup}
\mathbf{\phi} (\mathbf{x}) = \sum_{i = 1}^{m} w_{i} \| \mathbf{x} – P_{i}(\mathbf{x}) \|^{2} = \sum_{i = 1}^{m} w_{i} d_{i}(\mathbf{x})^{2}
\end{equation} \)

where \(d_{i}(\mathbf{x})\) measures the minimum distance between \(\mathbf{x}\) and the constraint set \(C_{i}\). The constraints may contradict each other in the sense that satisfying one constraint may cause the violation of the others. In this case, it may not be possible to find a point \(\mathbf{x}^{*}\) such that \(\mathbf{\phi} (\mathbf{x}^{*})= 0\); instead, a minimum in the least-squares sense can be found. \(w_{i}\) is a weighting factor that controls the influence of each constraint. Since it may not be possible to satisfy all the constraints simultaneously, by controlling \(w_{i}\) it is possible to specify more importance to satisfy some constraints by assigning it a larger weight in the equation.

Figure 2 illustrates the algorithm. In each iteration, the first step (Figure 2, left) computes the projection of the vertex onto the constraint sets. That is, the closest points to \(\mathbf{x}\) in each constraint set are computed. Next, the second step (Figure 2, right) computes a new value for \(\mathbf{x}\) by minimizing \(\mathbf{\phi}(\mathbf{x})\) while keeping the projections fixed. In Figure 2, the colored bars denote the error of the current estimate \(\mathbf{x}\). Note that the sum of the bars (i.e., the total error) decreases monotonically, even if the error of a specific constraint increases (e.g., the error associated with the constraint \(C_{1}\) is larger by the end of the second iteration in comparison to the start). As previously mentioned, it may not be possible to satisfy all the constraints simultaneously, but the alternating minimization algorithm minimizes the overall error in the least-squares sense.

Figure 2: Illustration of the alternating minimization algorithm employed by ShapeUp. In each iteration, the first step computes the projections of a vertex onto the constraint sets, while the second step updates the vertex position by minimizing the proximity function, keeping the projections fixed. Source: Bouaziz et. al 2012.

In practice, the optimization problem is solved for a set of vertices describing the shape, \(\mathbf{X}\), instead of a single position. The authors also incorporate a matrix \(\mathbf{N}\) to centralize the vertices \(\mathbf{X}\) around the mean, which can help in the convergence to the solution. The alternating minimization employed by ShapeUp is similar to the procedure described for ARAP:

  1. Define the vertices \(\mathbf{X}\), the constraints set \(\{ C_{1}, C_{2} , …, C_{m} \}\) and the shape projection operators \(P_{1}, P_{2}, …, P_{m}\);
  2. Assuming that the vertices \(\mathbf{X}\) are fixed, solve the minimization for \(P_{i}(\mathbf{N}_{i}\mathbf{X}_{i})\) using least-squares shape matching, where \(\mathbf{X}_{i} \subseteq \mathbf{X}\) denotes the vertices influenced by the constraint \(C_{i}\);
  3. Using the solutions found in the previous step for \(P_{i}(\mathbf{N}_{i}\mathbf{X}_{i})\), solve the minimization for \(\mathbf{X}\);
  4. Repeat steps (2) and (3) until some condition is met (e.g., a maximum number of iterations is reached).

Figure 3 shows the result of the shape deformation for a kirigami linkage, where the bottom-left corner was constrained to stay in the initial position while the top-right corner was constrained to move to a different position. The remaining vertices are constrained to move while preserving the edge lengths i.e., without introducing stretching during shape deformation. The results shown represent the solution found by the optimization method for 8, 16, 64 and 256 iterations (left to right). Depending on the particular position that the top-right corner was constrained to move to, it may not be possible to find a perfectly rigid transformation. However, as was the case with ARAP, the alternating minimization process will find the best solution in the least squares sense. The advantage of ShapeUp is the possibility to introduce different and generic types of constraints.

Figure 3: Results for the alternating minimization of ShapeUp using 8, 16, 64, and 256 iterations (left to right).

ShapeUp and Projective Dynamics were combined in the ShapeOp [11] framework to support both geometry processing and physical simulation in a unified solver. The framework defines a set of energy terms that quantify each constraint’s deviation. These energy terms are usually quadratic or higher-order functions that quantify the deviation from the desired shape. ShapeOp finds an optimal shape configuration that satisfies the constraints by minimizing the overall energy of the system. For dynamics simulation tasks, ShapeOp employs the Projective Implicit Euler integration scheme, where the physical and geometric constraints are resolved using the local-global solver described below at each integration step. ShapeOp provides stability, typical of implicit methods, while providing a lower computational cost due to the efficiency of the local-global alternating minimization.

In this framework, physical energy potentials and geometric constraints are solved in a unified manner. Each solver iteration consists of a local step and a global step defined as follows:

  • Local Step: for each set of points that is commonly influenced by a constraint, a candidate shape is computed. For a geometric constraint, this entails fitting a shape that satisfies the constraint, e.g., constraining a quadrilateral to be deformed into a square. For a physical constraint, this was reduced to locating the nearest point positions with zero physical potential value.
  • Global Step: the candidate shapes computed in the local step may be incompatible with each other. For instance, this may happen if the satisfaction of one constraint causes the violation of another constraint. The global step finds a new set of consistent positions so that each set of points subject to a common constraint is as close to the corresponding candidate shape as possible.

Animations 2 and 3 present the results of simulating a kirigami linkage under the effect of gravity (i.e., the force gravity is applied as an external force to the system) using ShapeOp framework and libigl. The edge strain constraint is used to simulate strain limiting. The closeness constraint is used to fix the position of two vertices on the top-row; this constraint projects the vertices into a specific rest position.

Animation 2: A kirigami linkage is subject to gravitational force with closeness constraints and edge strain constraints. In this case, the weight of the edge strain constraint is not large enough to prevent stretching.

For Animation 2, the weights of the edge strain and closeness constraints were \(w_{i} = 1000\) and \(w_{i} = 100\), respectively. As can be seen in Animation 2, the kirigami presents noticeable stretching, which is undesirable for near-rigid linkages. This means that this weighting scheme doesn’t provide sufficient importance to the edge strain constraint to guarantee strain limiting. Nonetheless, this shows that the shape optimization approach of ShapeUp and Projective Dynamics provide flexibility to design and simulate a wide range of constraints and materials depending on the goal.

Animation 3: A kirigami linkage is subject to gravitational force with edge strain constraints and closeness constraints. In this case, the weight of the edge strain constraint is much larger than the weight of the closeness constraint, resulting in a deformation that better preserves the rigidity of the material.

Animation 3 shows a simulation similar to Animation 2, but the weights of edge strain constraint and closeness constraint were \(w_{i} = 5000\) and \(w_{i} = 100\), respectively. In this case, the deformation is closer to a rigid motion and presents significantly less stretching.

Figure 4: Comparison between the relative root-mean-squared error during the frames of a simulation using the projective dynamics solver of ShapeOp. Animation 2 (left) introduces more distortion than Animation 3 (right) due to using a smaller weight for the edge strain constraint.

Figure 4 presents a quantitative comparison between Animation 2 (Figure 4, left) and Animation 3 (Figure 4, right) using the relative root-mean-squared error to measure the edge length distortion introduced during the simulation. As can be seen, Animation 3 exhibits considerably less stretching and converges to a final solution in fewer frames. As mentioned, this is caused by the fact that Animation 3 uses a larger weight to satisfy the edge strain constraint. By giving priority to satisfying the edge strain constraint, the edge length distortion is reduced. However, note that the final result for both Animation 2 and Animation 3 have an error greater than zero, indicating that the constraint set imposed cannot be perfectly satisfied.

Animation 4: A kirigami linkage is subject to both gravitational force and per-vertex force (in this case, dragging a vertex to the right), besides edge strain constraints and closeness constraints.

Finally, Animation 4 displays a simulation that also incorporates a user-supplied external force. In this simulation, besides the gravitational force, one vertex is also subject to a per-vertex force that drags it to the right. For instance, this force may be controlled by the user through mouse input. As the simulation executes, the kirigami is subject to both external forces and to the constraint sets. As before, the edge strain and closeness constraints were added to the optimization process.

V. Conclusions and Future Work

In this project we explored various geometric and physical aspects of kirigami linkages. By leveraging various techniques from geometry processing and numerical optimization, we could understand how to design, deform and simulate near-rigid materials that present a particular cutting pattern – the auxetic linkage.

As future work we may explore new types of constraints such as non-interpenetration constraints to prevent one triangle from intersecting others. Moreover, by using conformal geometry, we may replicate the surface rationalization approach of Konaković et al. 2016 [12] to approximate an arbitrary 3D surface using the auxetic linkage described above.

We would like to thank Professor Mina Konaković for the mentoring and insightful discussions. We were impressed by the vast number of surprising applications that could arise from an artistic pattern, ranging from fabrication and architecture to robotics. Furthermore, we would like to thank the SGI volunteer Nicole Feng for all the help during the project week, particularly with the codebase. Finally, this project would not have been possible without Professor Justin Solomon, so we are grateful for his hard work organizing SGI and making this incredible experience possible.

VI. References

[1]: Rubio, Alfonso P., et al.”Kirigami Corrugations: Strong, Modular and Programmable Plate Lattices.” ASME 2023 International Design Engineering Technical Conferences and Computers and Information in Engineering Conference (IDETC-CIE2023),(2023).

[2]: Dudte, Levi H., et al. “An additive framework for kirigami design.” Nature Computational Science 3.5 (2023): 443-454.

[3]: Yang, Yi, Katherine Vella, and Douglas P. Holmes. “Grasping with kirigami shells.” Science Robotics 6.54 (2021): eabd6426.

[4]: Konaković-Luković, Mina, Pavle Konaković, and Mark Pauly. “Computational design of deployable auxetic shells.” Advances in Architectural Geometry 2018.

[5]: Konaković-Luković, Mina, et al. “Rapid deployment of curved surfaces via programmable auxetics.” ACM Transactions on Graphics (TOG) 37.4 (2018): 1-13.

[6]: Grima, Joseph N., and Kenneth E. Evans. “Auxetic behavior from rotating squares.” Journal of materials science letters 19 (2000): 1563-1565.

[7]: Botsch, Mario, et al. Polygon mesh processing. CRC press, 2010.

[8]: Sorkine, Olga, and Marc Alexa. “As-rigid-as-possible surface modeling.” Symposium on Geometry processing. Vol. 4. 2007.

[9]: Bouaziz, Sofien, et al. “Shape‐up: Shaping discrete geometry with projections.” Computer Graphics Forum. Vol. 31. No. 5. Oxford, UK: Blackwell Publishing Ltd, 2012.

[10]: Bouaziz, Sofien, et al. “Projective Dynamics: Fusing Constraint Projections for Fast Simulation.” ACM Transactions on Graphics 33.4 (2014): Article-No.

[11]: Deuss, Mario, et al. “ShapeOp—a robust and extensible geometric modelling paradigm.” Modelling Behaviour: Design Modelling Symposium 2015. Springer International Publishing, 2015.

[12]: Konaković, Mina, et al. “Beyond developable: computational design and fabrication with auxetic materials.” ACM Transactions on Graphics (TOG) 35.4 (2016): 1-11.

Categories
Research

How to Mend a Broken Part

Fellows: Munshi Sanowar Raihan, Daniel Perazzo, Francheska Kovacevic, Gabriele Dominici

Volunteer: Elshadai Tegegn

Mentors: Silvia Sellán, Dena Bazazian

I. Introduction

In computer graphics, fracture simulation of everyday objects is a well-studied problem. Physics-based pre-fracture algorithms like Breaking Good [1] can be used to simulate how objects break down under different dynamic conditions. The inverse of this problem is geometric fracture assembly, where the task is to compose the components of a fractured object back into its original shape.

More concretely, we can formulate the fracture assembly task as a pose prediction problem. Given \(N\) mesh fractured pieces of an object, the goal is to predict a \(SE(3)\) pose for each fractured part. We can denote the predicted pose of the \(i_{th}\) fractured piece as \(p_i = \{(q_i, t_i)  |  q_i \in R^4, t_i \in R^3\}\), where \(q_i\) is a unit quaternion describing the rotation and \(t_i\) is the translation vector. We can apply the predicted pose to the vertices \(V_i\) of each fractured piece and get \(p_i(V_i) = q_i V_i q_i^{-1} + t_i\). The union of all of the pose-transformed pieces is our final assembly result, \(S = \bigcup p_i(V_i)\).

The goal of this project is to come up with an evaluation metric to compare different assembly algorithms and to host an open source challenge for the assembly task.

II. Rotation metric:

We will use unit quaternions \(q\) to represent rotations. Let’s assume for one of the pieces of the fracture, \(q_r\) is the true rotation and \(q_p\) is the predicted rotation. We might define a metric between two rotations as the Euclidean distance between two quaternions:

\(d(q_r, q_p) = ||q_r-q_p||^2\)

But a noteworthy property of quaternions is that two quaternions \(q\) and \(-q\) represent the same rotation. This can be verified as follows:

The rotation \(R\) related to quaternion \(q\) sends a vector \(v\) to the vector:

\(R(v) = qvq^{-1}\)

The rotation \(R’\) related to quaternion \(-q\) sends the vector \(v\) to the vector:

\begin{array} {lcl} R'(v) & = & (-q)v(-q)^{-1} \\ & = & (-1)^2 qvq^{-1} \\ & = & qvq^{-1} \end{array}

Which is the same as the rotation \(R\).

Directly using the Euclidean distance for quaternions would be ambiguous because the distance between the same rotations \(q\) and \(-q\) would be non-zero.

To alleviate this, we have to choose a sign convention for the quaternions. We choose the quaternions to always have a positive real part. When we encounter quaternions with negative real components, we flip its sign (which represents the same rotation).  Then we can compare the quaternions using the usual \(L^2\) distance. This is the pseudo code for our rotation metric:

def rotation_metric(qr, qp):
    if real(qr) < 0:
        qr = -qr
    if real(qp) < 0:
        qp = -qp
    return  sum((qr-qp)**2)

III. Translation Metric:

If \(t_r\) is the true translation and \(t_p\) is the predicted translation for one of our fractured pieces, we can directly use the \(L^2\) distance between the translation vectors as the translation metric:

\(d(t_r, t_q) = ||t_r – t_q||^2\)

IV. Relative rotation and translation:

Fig 1: Even when all the pieces are rotated or translated with respect to the ground truth, it can still be a valid shape assembly.

While evaluating a predicted pose we must be careful, because the predicted values can be very different from the ground truth but can still describe a valid shape assembly. This is illustrated in Fig 1:  We can rotate and translate all the pieces together by a certain amount that will result in a large value for our \(L^2\) metric, although this is a perfect shape assembly.

We solve this problem by measuring all the rotations and translations relative to one of the fragmented pieces. 

Let’s assume we have two pieces:

Piece 1: rotation \(q_1\), translation \(t_1\)

Piece 2: rotation \(q_2\), translation \(t_2\)

Then the relative rotation and translation of Piece 2, with respect to Piece 1, can be calculated as:

\(q_{rel} = q_1^{-1} q_2\)

\(t_{rel} =  q_1^{-1} (t_2-t_1) q_1\)

For both ground truth and prediction, we can calculate the relative rotations and translations of all the parts with respect to a chosen piece. Then we can easily use the \(L^2\) metrics defined above for comparison. This won’t affect the metric if all the pieces are moved together.

V. Codalab Challenge

We started implementing a Codalab challenge to explore this problem in all its complexities. For this, we set up a server that implemented the previously mentioned metrics and also started designing the type of submissions we could do. 

Our scripts consisted in a code to evaluate the submissions in the Codalab server, the reference data we used to perform the evaluation and a starter-kit that could be used by people that are starting in the competition. 

VI. References

[1] Silvia Sellán, Jack Luong, Leticia Mattos Da Silva, Aravind Ramakrishnan, Yuchuan Yang, Alec Jacobson. “Breaking Good: Fracture Modes for Realtime Destruction”. ACM Transactions on Graphics 2022.

[2] Silvia Sellán, Yun-Chun Chen, Ziyi Wu, Animesh Garg, Alec Jacobson. “Breaking Bad: A Dataset for Geometric Fracture and Reassembly”. Neural Information Processing Systems 2022.

Categories
Research

Random Meshes

Fellows: Aditya Abhyankar, Munshi Sanowar Raihan, Shanthika Naik, Bereket Faltamo, Daniel Perazzo

Volunteer: Despoina Paschalidou

Mentor: Nicholas Sharp

I. Introduction

Triangular and tetrahedral meshes are central to geometry, we use them to represent shapes, and as bases to compute with. Many numerical algorithms only actually work well on meshes that have nicely-shaped triangles/tetrahedra, so we try very hard to generate meshes which simultaneously:

  1.  Represent the desired shape
  2.  Have nicely-shaped elements and 
  3. Perfectly interlock to cover the domain with no gaps or overlaps. 

Yet, is point (3) really that important? What if instead we just sampled a soup of random nicely-shaped triangles, and didn’t worry about whether they fit together? 

In this project we explore several strategies for generating such random meshes, and evaluate their effectiveness. 

II. Algorithms

II.1. Triangle Sampling

 Fig 1: The heat geodesic method fails if the triangles are isolated (left); but if the triangles share vertex entries, the heat method works even with gaps and intersections (right).

In random meshing, we are given the boundary of a shape (e.g. the polygon outline of a 2D figure) and the task is to generate random meshes to tessellate the interior. Here, we will focus mainly on the planar case, where we generate triangles with 2D vertex positions. We will test the generated meshes by running the Heat Method [2], a simulation-based algorithm for computing distance within a shape. The very first shape we tried to tessellate is a circular disk.

Since a circle is a convex shape, we can choose three random points inside the circle and any triangle is guaranteed to stay within the shape. But generating isolated triangles like these is not a good strategy, because downstream algorithms like the heat method rely on shared vertices to communicate across the mesh. Without shared vertices, it is equivalent to running the algorithm individually on a bunch of separate triangles one at a time.

Next strategy: At each vertex, consider generating n random triangles that are connected to other vertices within a certain radius. This ensures that the generated triangles share the same vertex entries. Even though these random triangles have many gaps and intersections, many algorithms are actually perfectly well-defined on such a mesh. To our surprise, the heat method was able to generate reasonable results even with these random soup of triangles (Fig 1).

II.2. Non-Convex Shapes

Fig 2: Random meshing of a non-convex star shape (left); mesh generated by rejection sampling of the triangles (right).

For non-convex shapes, if we try to connect any three points within the polygon, some of the triangles might fall outside of our 2D boundary. This is illustrated in Fig 2 (left). To circumvent this problem, we can do rejection sampling of the triangles. Every time we generate a new triangle, we need to test whether it is completely contained within the boundary of our polygon. If it’s not, we reject it from our face list and sample another one. After rejection, the random meshes seem to nicely follow the boundary. Rejection sampling makes our meshing algorithm a little slower, but it’s necessary to handle non-convex shapes.

II.3. Triangle Size

Fig 3: Random meshes with different triangle size (left) and the isolines of their geodesic distance from the source (right).

In random meshes, we find that the performance of the heat geodesic method is dependent on the size of the triangles. Since we are generating triangles by sampling points within a radius, we can make the triangles smaller or larger by controlling the radius of the circle. With decreasing triangle size, the distance computed by the heat method becomes more accurate. This is illustrated in Fig 3: as the triangles become smaller, the isolines look more precise. The number of triangles are kept fixed in all cases.

III. Visualizations and results

We created an interface to aid in the task of drawing different polygon shapes for visualization. As can be seen below, an example of a shape:

We can use one of our algorithms to plot various types of meshes with the distance function drawn by the heat equation. We put the visualization of these meshes bellow, where the leftmost is the mesh using Delaunay triangulation, the rightmost using random triangles and the center being using Delaunay triangulation but using the faces from the Delaunay triangulation for a better visualization.

In this case, with 5000 points sampled randomly, we have an error of 0.0002 compared with the values for the distance function compared with using the heat method.

IV. An Attempt at Random Walk Meshing

Another interesting meshing idea is spawning a single vertex somewhere in the interior of the shape, and then iteratively “growing” the mesh from there in the style of a random walk. At each iteration, every leaf vertex randomly spawns two more child vertices on the circumference of a circle surrounding it, which are used to form a new face. If any such spawning circle intersects with the boundary of the shape, we simply use the two vertices of the closest boundary edge instead to form the new face. We tried various types of random walk strategies, such as using correlated random walks with various correlation settings to mitigate clustering at the source vertex. 

While this produced an interesting single component random mesh, the sparse connectivity made it a bad algorithm for the heat method, as triangle sequences that swiveled back around in the direction of the source vertex diffused heat backwards in that direction too.

This caused the distance computations to be inaccurate and rendered the other methods superior. We would like to explore this approach further though, as it might prove useful for other use-cases like physics simulations and area approximations. Random walks are very well studied in probability literature too, so deriving theoretical results for such algorithms seems like a very principled task.

V. Structure in Randomness

While sampling triangles within a radius gave a reasonable results upon calculating geodesic distance, we tried exploring ways to make it more structured. One such method we came with is grid sampling with triangulation within a neighborhood. The steps are as follows:

  1. Uniformly sample points within a square grid enclosing the entire shape.
  2. Eliminate points outside that fall out of the desired shape.
  3. For each vertex within the shape, form a fan of triangles with its 1 ring neighborhood vertices.

These are the geodesic isolines on the triangular mesh obtained using the above method.

VI. Conclusion and Future Work

We present some examples of our random computation method working on 2D meshes for various different shapes. Aside from refining our algorithms and performing more experiments, one interesting avenue would be to perform experiments with tetrahedralization on 3D shapes. We have also done simple tests with current state-of-the-art tetrahedralization algorithms [3], the results are shown below. So, for future work, this would be a really interesting avenue. Another interesting avenue for theoretical work regarding random walk meshing would be computing how the density of triangles varies with iteration count and various degrees of correlation.

VII. References

[1] Shewchuk, Jonathan Richard. “Triangle: Engineering a 2D quality mesh generator and Delaunay triangulator.” Workshop on applied computational geometry. Berlin, Heidelberg: Springer Berlin Heidelberg, 1996.

[2] Crane, Keenan, Clarisse Weischedel, and Max Wardetzky. “The heat method for distance computation.” Communications of the ACM 60.11 (2017): 90-99.

[3] Hu, Yixin, et al. “Tetrahedral meshing in the wild.” ACM Trans. Graph. 37.4 (2018): 60-1.

[4] Hu, Yixin, et al. “Fast tetrahedral meshing in the wild.” ACM Transactions on Graphics (TOG) 39.4 (2020): 117-1.

Categories
Research

Geometric Surface Characterization

Students: Tewodros (Teddy) Tassew, Anthony Ramos, Ricardo Gloria, Badea Tayea

TAs: Heng Zhao, Roger Fu

Mentors: Yingying Wu, Etienne Vouga

Introduction

Shape analysis has been an important topic in the field of geometry processing, with diverse interdisciplinary applications. In 2005, Reuter, et al., proposed spectral methods for the shape characterization of 3D and 2D geometrical objects. The paper demonstrates that the Laplacian operator spectrum is able to capture the geometrical features of surfaces and solids. Besides, in 2006, Reuter, et al., proposed an efficient numerical method to extract what they called the “Shape DNA” of surfaces through eigenvalues, which can also capture other geometric invariants. Later, it was demonstrated that eigenvalues can also encode global properties like topological features of the objects. As a result of the encoding power of eigenvalues, spectral methods have been applied successfully to several fields in geometry processing such as remeshing, parametrization and shape recognition.  

In this project, we present a discrete surface characterization method based on the extraction of the top smallest k eigenvalues of the Laplace-Beltrami operator. The project consists of three main parts: data preparation, geometric feature extraction, and shape classification. For the data preparation, we cleaned and remeshed well-known 3D shape model datasets; in particular, we processed meshes from ModelNet10, ModelNet40, and Thingi10k. The extraction of geometric features is based on the “Shape DNA” concept for triangular meshes which was introduced by Reuter, et al. To achieve this, we computed the Laplace-Beltrami operator for triangular meshes using the robust-laplacian Python library.

Finally, for the classification task, we implemented some machine learning algorithms to classify the smallest k eigenvalues. We first experimented with simple machine learning algorithms like Naive Bayes, KNN, Random Forest, Decision Trees, Gradient Boosting, and more from the sklearn library. Then we experimented with the sequential model Bidirectional LSTM using the Pytorch library to try and improve the results. Each part required different skills and techniques, some of which we learned from scratch and some of which we improved throughout the two previous weeks. We worked on the project for two weeks and received preliminary results.  The GitHub repo for this project can be found in this GitHub repo.

Data preparation

The datasets used for the shape classification are:

1. ModelNet10: The ModelNet10 dataset, a subset of the larger ModelNet40 dataset, contains 4,899 shapes from 10 categories. It is pre-aligned and normalized to fit in a unit cube, with 3,991 shapes used for training and 908 shapes for testing.

2. ModelNet40: This widely used shape classification dataset includes 12,311 shapes from 40 categories, which are pre-aligned and normalized. It has a standard split of 9,843 shapes for training and 2,468 for testing, making it a widely used benchmark. 

3. Thingi10k: Thingi10k is a large-scale dataset of 10,000 models from thingiverse.com, showcasing the variety, complexity, and quality of real-world models. It contains 72 categories that capture the variety and quality of 3D printing models.

For this project, we decided to use a subset of the ModelNet10 dataset to perform some preprocessing steps on the meshes and apply a surface classification algorithm due to the number of classes it has for analysis. Meanwhile, the ModelNet10 dataset is unbalanced, so we selected 50 shapes for training and 25 for testing per class.

Moreover, ModelNet datasets do not fully represent the surface representations of objects; self-intersections and internal structures are present, which could affect the feature extraction and further classification. Therefore, for future studies, a more careful treatment of mesh preprocessing is of primary importance.

Preprocessing Pipeline

After the dataset preparation, the preprocessing pipeline consists of some steps to clean up the meshes. These steps are essential to ensure the quality and consistency of the input data, and to avoid errors or artifacts. We used the PyMeshLab library, which is a Python interface to MeshLab, for mesh processing. The pipeline consists of the following steps:

1. Remove unreferenced vertices: This method gets rid of any vertices that don’t belong to a face.

2. Merge nearby vertices: This function combines vertices that are placed within a certain range (i.e.,  ε = 0.001)

3. Remove duplicate faces and faces with zero areas: It eliminates faces with the same features or no area. 

4. Removes connected components that have fewer faces than a specified number (i.e. 10): The effectiveness and accuracy of the model can be enhanced by removing isolated mesh regions that are too small to be useful.

5. Repair non-manifold edges and vertices: It corrects edges and vertices that are shared by more than two faces, which is a violation of the manifold property. The mesh representation can become problematic with non-manifold geometry.

6. Compute the normal vectors: The orientation of the adjacent faces is used to calculate the normal vectors for each mesh vertex.

These steps allow us to obtain clean and consistent meshes that are ready for the remeshing process.

Figure 1 Preprocessing Pipeline

Adaptive Isotropic Remeshing

The quality of the meshes is one of the key problems with the collected 3D models. When discussing triangle quality, it’s important to note that narrow triangles might result in numerical inaccuracies when the Laplace-Beltrami operator is being computed. In that regard, we remeshed each model utilizing adaptive isotropic remeshing implemented in PyMeshLab. Triangles with a favorable aspect ratio can be created using the procedure known as isotropic remeshing. In order to create a smooth mesh with the specified edge length, the technique iteratively carries out simple operations like edge splits, edge collapses, and edge flips. 

Adaptive isotropic remeshing transforms a given mesh into one with non-uniform edge lengths and angles, maintaining the original mesh’s curvature sensitivity. It computes the maximum curvature for the reference mesh, determines the desired edge length, and adjusts split and collapse criteria accordingly. This technique also preserves geometric details and reduces the number of obtuse triangles in the output mesh.

 Figure 2 Difference between uniform and adaptive isotropic remeshing. (src: stanford lecture slides)

Adaptive Isotropic Remeshing on ModelNet Dataset

We applied the PyMeshLab function ms.meshing_isotropic_explicit_remeshing() to remesh the ModelNet10 dataset for this project. We experimented with different parameters of the isotropic remeshing algorithm from PyMeshLab to optimize the performance. The optimal parameters for time, type of remesh, and triangle quality were iterations=6, adaptive=True, and targetlen=pymeshlab.Percentage(1) respectively. The adaptive=True parameter enabled us to switch from uniform to adaptive isotropic remeshing. Figure 3 illustrates the output of applying adaptive remeshing to the airplane_0045.off mesh from the ModelNet40 training set. We also tried the pygalmesh.remesh_surface() function, but it was very slow and produced unsatisfactory results.

Figure 3  Plot for time vs target length  (left) and the yellow airplane is the re-meshing result for parameter values of Iterations = 6 and targetlen = 1% while the blue airplane is the original mesh (right).

The Laplace-Beltrami Spectrum Operator

In this section, we introduce some of the basic theoretical foundations used for our characterization. Specifically, we define the Laplacian-Beltrami operator along with some of its key properties, explain the significance of the operator and its eigenvalues, and display how it has been implemented in our project.

Definition and Properties of the Laplace-Beltrami Operator

The Laplacian-Beltrami operator, often denoted as Δ, is a differential operator which acts on smooth functions on a Riemannian manifold (which, in our case, is the 3D surface of a targeted shape). The Laplacian-Beltrami operator is an extension of the Laplacian operator in Euclidean space, adjusted for curved surfaces on the manifold. Mathematically, the Laplacian-Beltrami operator acting on a function on a manifold is defined using the following formula:

where i denotes the i-th partial derivative, g is the determinant of the metric tensor gij of the manifold and gij is the inverse of the metric tensor.

The Laplacian-Beltrami operator serves as a measure of how the value of f at a point deviates from its average value within infinitesimally small neighborhoods around that point. Therefore, the operator can be adopted to describe the local geometry of the targeted surface.

The Eigenvalue Problem and Its Significance

Laplacian-Beltrami operator is a second-order function applied to a surface, which could be represented as a matrix whose eigenvalues/eigenvectors provide information about the geometry and topology of a surface. 

The significance of the eigenvalue problem as a result of applying the Laplace-Beltrami Operator includes:

  • Functional Representation. The eigenfunctions corresponding to a particular geometric surface form an orthonormal basis of all functions on the surface, providing an efficient way to represent any function on the surface.
  • Surface Characterization. A representative feature vector containing the eigenvalues creates a “Shape-DNA” of the surface, which captures the most significant variations in the geometry of the surface. 
  • Dimensionality Reduction. Using eigenvalues can effectively reduce the dimensionality of the data used, aiding in more efficient processing and analysis.
  • Feature Discrimination. The geometric variations and differences between surfaces can be identified using eigenvalues. If two surfaces have different eigenvalues, they are likely to have different geometric properties. Surface eigenvalue analysis can be used to identify features that are unique to each surface. This can be beneficial in computer graphics and computer vision applications where it is necessary to distinguish between different surfaces.

Discrete Representation of Laplacian-Beltrami Operator

In the discrete setting, the Laplacian-Beltrami operator is defined on the given meshes. The Discrete Laplacian-Beltrami operator L can be defined and computed using different approaches.  An often-used representation is using the cotangent matrix defined as follows:

Then L = M-1C where M is the diagonal mass matrix whose i-th entry is the shaded area as shown in Figure 4 for each vertex i. The Laplacian matrix is a symmetric positive-semidefinite matrix. Usually, L is sparse and stored as a sparse matrix in order not to waste memory.

Figure 4 (Left) Definition of edge i-j and angles for a triangle mesh. (Right) Representation of Voronoi area for vertex vi.

A Voronoi diagram is a mathematical method for dividing a plane into areas near a collection of objects, each with its own Voronoi cell. It contains all of the points that are closer to it than any other object. Since its origin, engineers have utilized the Delaunay triangulation to maximize the minimum angle among possible triangulations of a fixed set of points. In a Voronoi diagram, this triangulation corresponds to the nerve cells.

Experimental Results

In our experiments, we rescaled the vertices before computing the cotangent Laplacian. Rescaling mesh vertices changes the size of an object without changing its geometry. This Python function rescales a 3D point cloud by translating it to fit within a unit cube centered at the origin. It then scales the point cloud to have a maximum norm of 1, ensuring its center is at the origin. The function then finds the maximum and minimum values of each dimension in the input point cloud, computes the size of the point cloud in each dimension, and computes a scaling factor for each dimension. The input point cloud is translated to the center at the origin and scaled by the maximum of these factors, resulting in a point cloud with a maximum norm of 1.

Throughout this project, we used the robust-laplacian Python package to compute the Laplacian-Beltrami operator. This library deals with point clouds instead of triangle meshes. Moreover, the package can handle non-manifold triangle meshes by implementing the algorithm described in A Laplacian for Nonmanifold Triangle Meshes by Nicholas Sharp and Keenan Crane.

For the computation of the eigenvalues, we used the SciPy Python library. Let’s recall the eigenvalue problem Lv = λv, where λ is a scalar, and v is a vector. For a linear operator L,  we called λ eigenvalue and v eigenvector respectively. In our project, the smallest k eigenvalues and eigenfunctions corresponding to 3D surfaces formed feature vectors for each shape, which were then used as input of machine learning algorithms for tasks such as shape classification. 

Surface Classification

The goal of this project was to apply spectral methods to surface classification using two distinct datasets: a synthetic one and ModelNet10. We used the Trimesh library to create some basic shapes for our synthetic dataset and performed remeshing on each shape. This was a useful step to verify our approach before working with more complicated data. The synthetic data had 6 classes with 50 instances each. The shapes were Annulus, Box, Capsule, Cone, Cylinder, and Sphere. We computed the first 30 eigenvalues on 50 instances of each class, following the same procedure as the ModelNet dataset so that we could compare the results of both datasets. We split the data into 225 training samples and 75 testing samples.

For the ModelNet10 dataset, we selected 50 meshes for the training set and 25 meshes for the testing set per class. In total, we took 500 meshes for the training set and 250 meshes for the testing set. After experimenting with different machine learning algorithms, the validation results for both datasets are summarized below in Table 1. The metric used for the evaluation procedure is accuracy.

ModelsAccuracy for Synthetic DatasetAccuracy for ModelNet 10
KNN0.490.31
Random forest0.690.33
Linear SVM0.360.11
RBF SVM0.600.10
Gaussian Process0.590.19
Decision Tree0.560.32
Neural Net0.680.10
AdaBoost0.430.21
Naive Bayes0.230.19
QDA0.720.21
Gradient Boosting0.710.31
Table 1 Accuracy for synthetic and ModelNet10 datasets using different machine learning algorithms.

From Table 1 we can observe that the decision tree, random forest, and gradient boosting algorithms performed well on both datasets. These algorithms are suitable for datasets that have graphical features. We used the first 30 eigenvalues on 50 samples of each class for both the ModelNet and synthetic datasets, ensuring a fair comparison between the two datasets. Figure 5 shows the classification accuracy for each class using the confusion matrix.

Figure 5 Confusion matrix using Random Forest on the synthetic dataset (left) and ModelNet10 dataset (right). 

We conducted two additional experiments using deep neural networks implemented in Pytorch, besides the machine learning methods we discussed before. The first experiment involved a simple MLP model consisting of 5 fully connected layers, each with the Batch Norm and ReLU activation functions. The model achieved an accuracy of 57% on the synthetic dataset and 15% on the ModelNet10 dataset for the testing set. The second experiment used a sequential model called Bidirectional LSTM with two layers. The model achieved an accuracy of 34% for the synthetic dataset and 33% for the ModelNet10 dataset based on the testing set. These are reasonable results since the ModelNet dataset contains noise, artifacts, and flaws, potentially affecting model accuracy and robustness. Examples include holes, missing components, uneven surfaces, and most importantly, the interior structures. All of these issues could potentially impact the overall performance of the models, especially for our classification purposes. We present the results in Table 2. The results indicate that the MLP model performed well on the synthetic dataset while the Bi-LSTM model performed better on the ModelNet10 dataset.

ModelsAccuracy for Synthetic DatasetAccuracy for ModelNet 10
MLP0.570.15
Bi-LSTM0.340.33
Table 2 Accuracy for synthetic and ModelNet10 datasets using deep learning algorithms.

Future works

We faced some challenges with the ModelNet10 dataset. The dataset had several flaws that resulted in lower accuracy when compared to the synthetic dataset. Firstly, we noticed some meshes with disconnected components, which caused issues with the computation of eigenvalues, since we would get one zero eigenvalue for each disconnected component, lowering the quality of the features computed for our meshes. Secondly, these meshes had internal structures, i.e., vertices inside the surface, which also affected the surface recognition power of the computed eigenvalues, as well as other problems related to self-intersections and non-manifold edges.

The distribution of eigenvalues in a connected manifold is affected by scaling. The first-k eigenvalues are related to the direction encapsulating the majority of the manifold’s variation. Scaling by α results in a more consistent shape with less variation along the first-k directions. On the other hand, scaling by 1/α causes the first-k eigenvalues to grow by α2, occupying a higher fraction of the overall sum of eigenvalues. This implies a more varied shape with more variance along the first-k directions.

To address the internal structures problem, we experimented with several state-of-the-art surface reconstruction algorithms for extracting the exterior shape and removing internal structures using the Ball Pivoting, Poisson Distribution methods from the Python PyMeshLab library, and Alpha Shapes. One of the limitations of ball pivoting is that the quality and completeness of the output mesh depend on the choice of the ball radius. The algorithm may miss some parts of the surface or create holes if the radius is too small. Conversely, if the radius is too large, the method could generate unwanted triangles or smooth sharp edges. Ball pivoting also struggles with noise or outliers and can result in self-intersections or non-manifold meshes.

By using only vertices to reconstruct the surface, we significantly reduced the computational time but the drawback was that the extracted surface was not stable enough to recover the entire surface. It also failed to remove the internal structures completely. In future work, we intend to address this issue and create an effective algorithm that can extract the surface from this “noisy” data. For this issue, implicit surface approaches show great promise.

References

Reuter, M., Wolter, F.-E., & Niklas Peinecke. (2005). Laplace-spectra as fingerprints for shape matching. Solid and Physical Modeling. https://doi.org/10.1145/1060244.1060256 

Reuter, M., Wolter, F.-E., & Niklas Peinecke. (2006). Laplace–Beltrami spectra as “Shape-DNA” of surfaces and solids. Computer Aided Design, 38(4), 342–366. https://doi.org/10.1016/j.cad.2005.10.011

Reuter, M., Wolter, F.-E., Shenton, M. E., & Niethammer, M. (2009). Laplace–Beltrami eigenvalues and topological features of eigenfunctions for statistical shape analysis. 41(10), 739–755. https://doi.org/10.1016/j.cad.2009.02.007

Sharp, N., & Crane, K. (2020). A Laplacian for Nonmanifold Triangle Meshes. 39(5), 69–80. https://doi.org/10.1111/cgf.14069

Yan, D.-M., Lévy, B., Liu, Y., Sun, F., & Wang, W. (2009). Isotropic Remeshing with Fast and Exact Computation of Restricted Voronoi Diagram. Computer Graphics Forum, 28(5), 1445–1454. https://doi.org/10.1111/j.1467-8659.2009.01521.x

CS468: Geometry Processing Algorithms Home Page. (n.d.). Graphics.stanford.edu. Retrieved July 29, 2023, from http://graphics.stanford.edu/courses/cs468-12-spring/

Muntoni, A., & Cignoni, P. (2021). PyMeshLab [Software]. Zenodo. https://pymeshlab.readthedocs.io/en/latest/about.html

M. Rustamov, R. (2007). Laplace-Beltrami Eigenfunctions for Deformation Invariant Shape Representation (A. Beyaev & M. Garland, Eds.). Retrieved July 29, 2023, from https://www.cs.jhu.edu/~misha/ReadingSeminar/Papers/Rustamov07.pdf

Nealen, A., Igarashi, T., Sorkine, O., & Alexa, M. (2006). Laplacian mesh optimization. Conference on Computer Graphics and Interactive Techniques in Australasia and Southeast Asia. https://doi.org/10.1145/1174429.1174494 

Floater, M. S., & Hormann, K. (2005). Surface Parameterization: a Tutorial and Survey. Springer EBooks, 157–186. https://doi.org/10.1007/3-540-26808-1_9

Categories
Tutorial week

Last Day of SGI 2023 Tutorial Week

After many exercises, lectures, presentations, and MATLABs abruptly closing, we reached the end of the first week of SGI 2023. It was a wild and incredible ride. And we reach the end with a course by Nicholas Sharp on Robustness in Geometry Processing. We also had a guest lecture by Teseo Schneider and, finally, our release of the projects for the next week. Having this experience while in my home city of Recife, Brazil is incredible.

In Sharp’s presentation, we learned that meshes extracted from real data are much less clean than ideal meshes. So, we must create techniques and methods to perform robust geometry processing. In the first part, we learned about floating point arithmetic. We learned that contrary to what we programmers want to think, floating point numbers are NOT real numbers and can introduce many errors during arithmetic. For example, we learned that there are better ideas than performing a strict equality comparison and that we should add a tolerance factor to account for errors.

We also got an introduction to different numerical solvers and how meshes with some properties can break numerical solvers. Although these properties can result from error, sometimes they are intentional. As an example of such properties that can break processing, meshes can have:

  • Duplicate Vertices
  • Faces of wrong orientation
  • Can be nonmanifolds
  • And many more

To get a feeling of how to perform different processing methods, we did some activities on how to do processing with “bad meshes” Those activities are available here. One such example was an activity on bad meshes. For example, we were given a “bad_armadillo”, a variation of the traditional armadillo mesh that, when loaded, looked odd:

To correct this issue, we used Meshlab. When we loaded it into Meshlab, it became clear that some normals were inverted:

So, after orienting the meshes to the right side, we “fixed the mesh”:

And now MATLAB can load it the proper way.

We also got a presentation by Professor Teseo Schneider of the University of Victoria on their work on collision detection. Their technique could simulate different structures such as chains, arches, dimensional card houses, and even a cube rotating in a turntable with varying friction parameters. To end the lecture, he showed a really satisfying simulation of a stack of bricks being hit by a wrecking ball (Figure taken from his paper, available here):

Finally, at the end of the day, we got the list of the projects we will work on next week. I was paired with many amazingly talented fellow students (one of them is also Brazilian like me!) to work on a project on Hybrid Neural and Grid Representations, mentored by Peter Chen. I can’t wait for what SGI 2023 has in store!